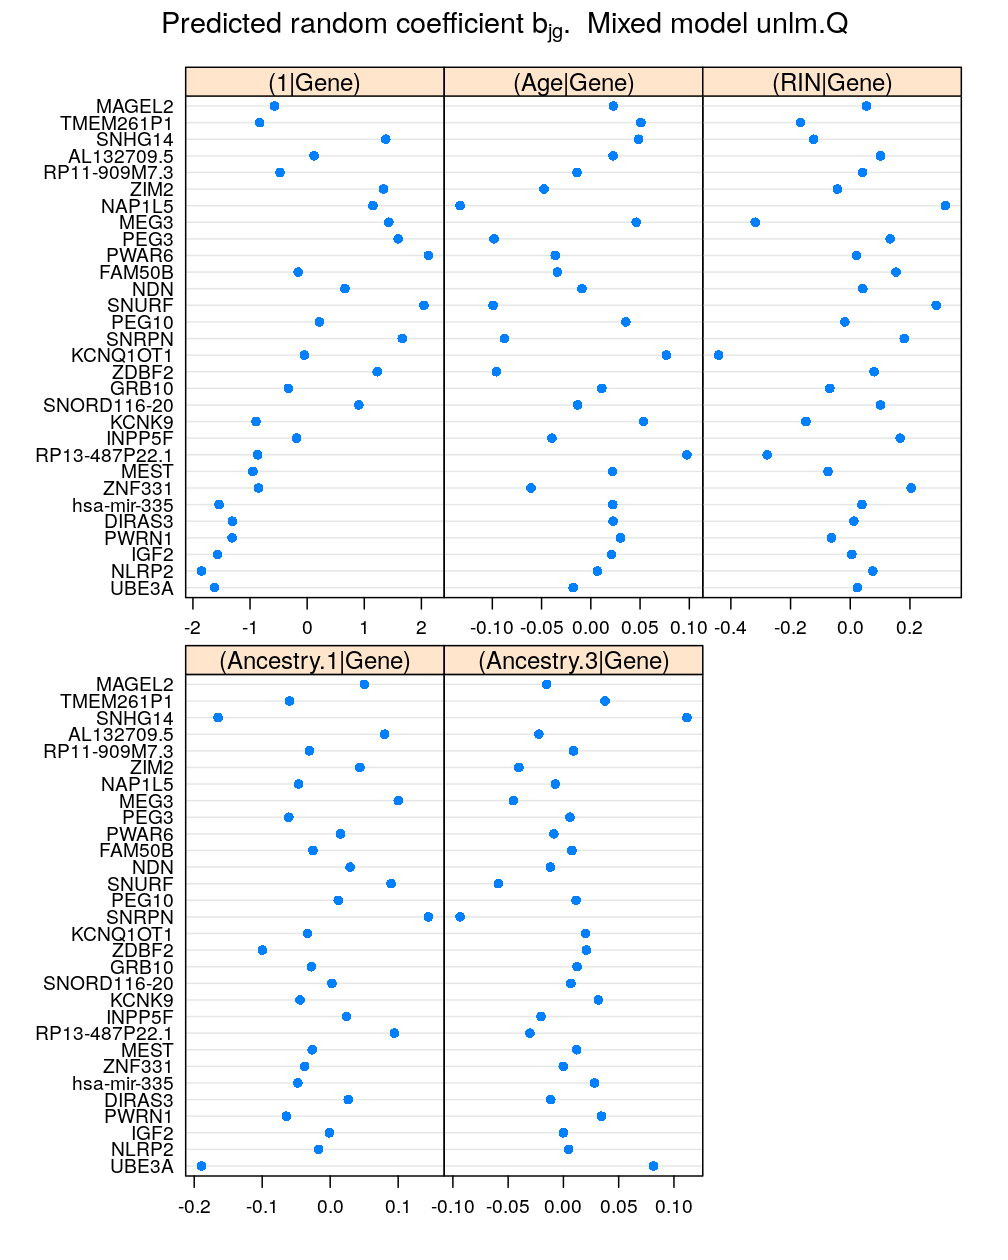
Predict random regression coefficients of the mixed effect model M5 (the best fitting model). This uses the ranef function of the lme4 R package. As the documentation says: “[ranef is a] generic function to extract the conditional modes of the random effects from a fitted model object. For linear mixed models the conditional modes of the random effects are also the conditional means.”
Preliminaries
Get selected genes (inferred to be imprinted)
gene.ids <- unlist(read.csv("../../data/genes.regression.new", as.is = TRUE))
names(gene.ids) <- gene.ids
dat <- merge.data(gene.ids = gene.ids)
Get model M5 formula and fit to data. M6 is also fitted.
get.formula <- function(model.name = "M5") {
    x <- read.csv(file = "../../results/M-formulas.csv", stringsAsFactors = FALSE)[[model.name]]
    formula(do.call(paste, as.list(x[c(2, 1, 3)])))
}
M5 <- lmer(get.formula("M5"), data = dat)
M6 <- lmer(get.formula("M6"), data = dat)
To recapitulate, the linear predictor of M5 contains the following terms:
formula(M5)
## Q ~ scale(RIN) + (1 | RNA_batch) + (1 | Institution) + (1 | Institution:Individual) +
##     (1 | Gene:Institution) + (1 | Gender:Gene) + (scale(Age) +
##     scale(RIN) + scale(Ancestry.1) + scale(Ancestry.3) | Gene)
## <environment: 0x562d327adf38>
Recall that the ‘1’s are intercept terms, the rest are slope terms; each kind has its own sets of random coefficients.
Results
Only the biologically meaningful terms are analyzed here, which represent the random effects of Gene and Gender:Gene. Let’s look at the coefficients for Gene first:
mydotplot(x = get.coef("Gene", M5), layout = c(3, 2))

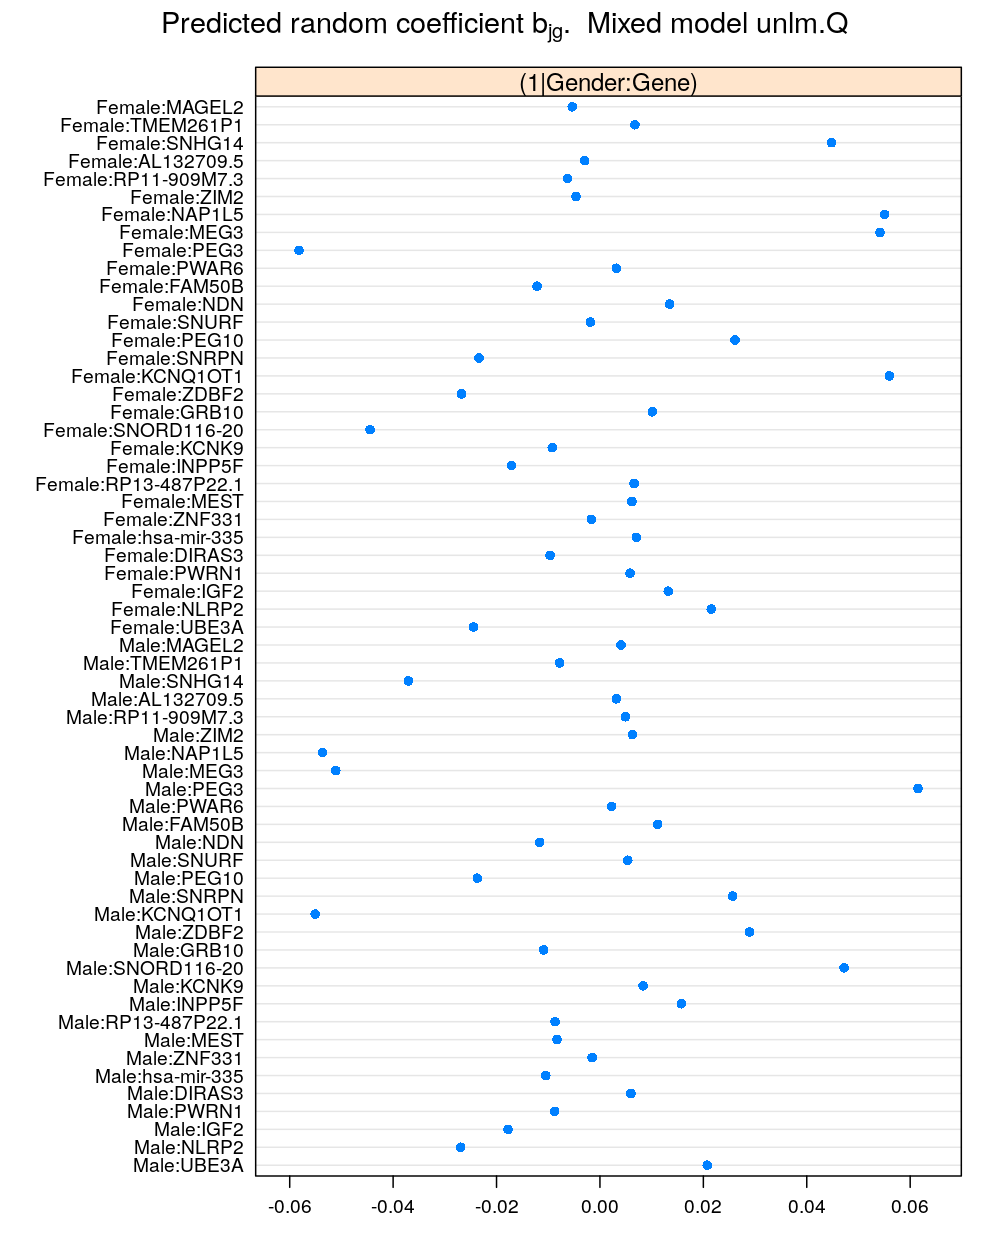
Next, the coefficients for Gender:Gene. Since this is an interaction of two factors with 2 and 30 levels, respectively, there are 60=2×30 levels and the same number of random coefficients for the intercept term:
mydotplot(x = get.coef("Gender:Gene", M5))

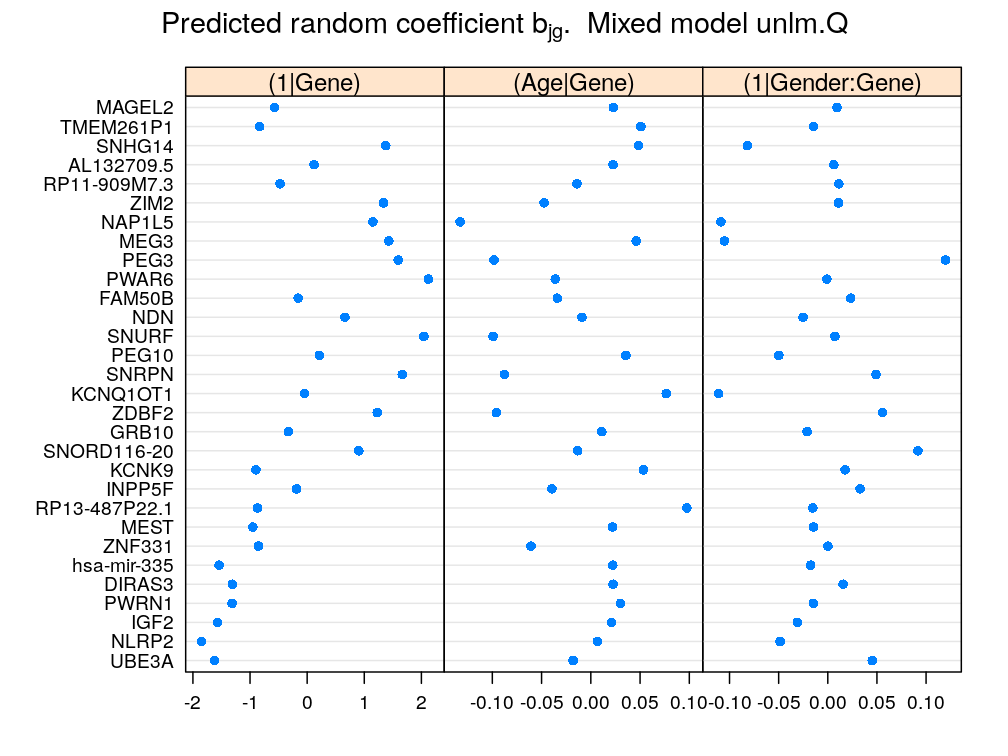
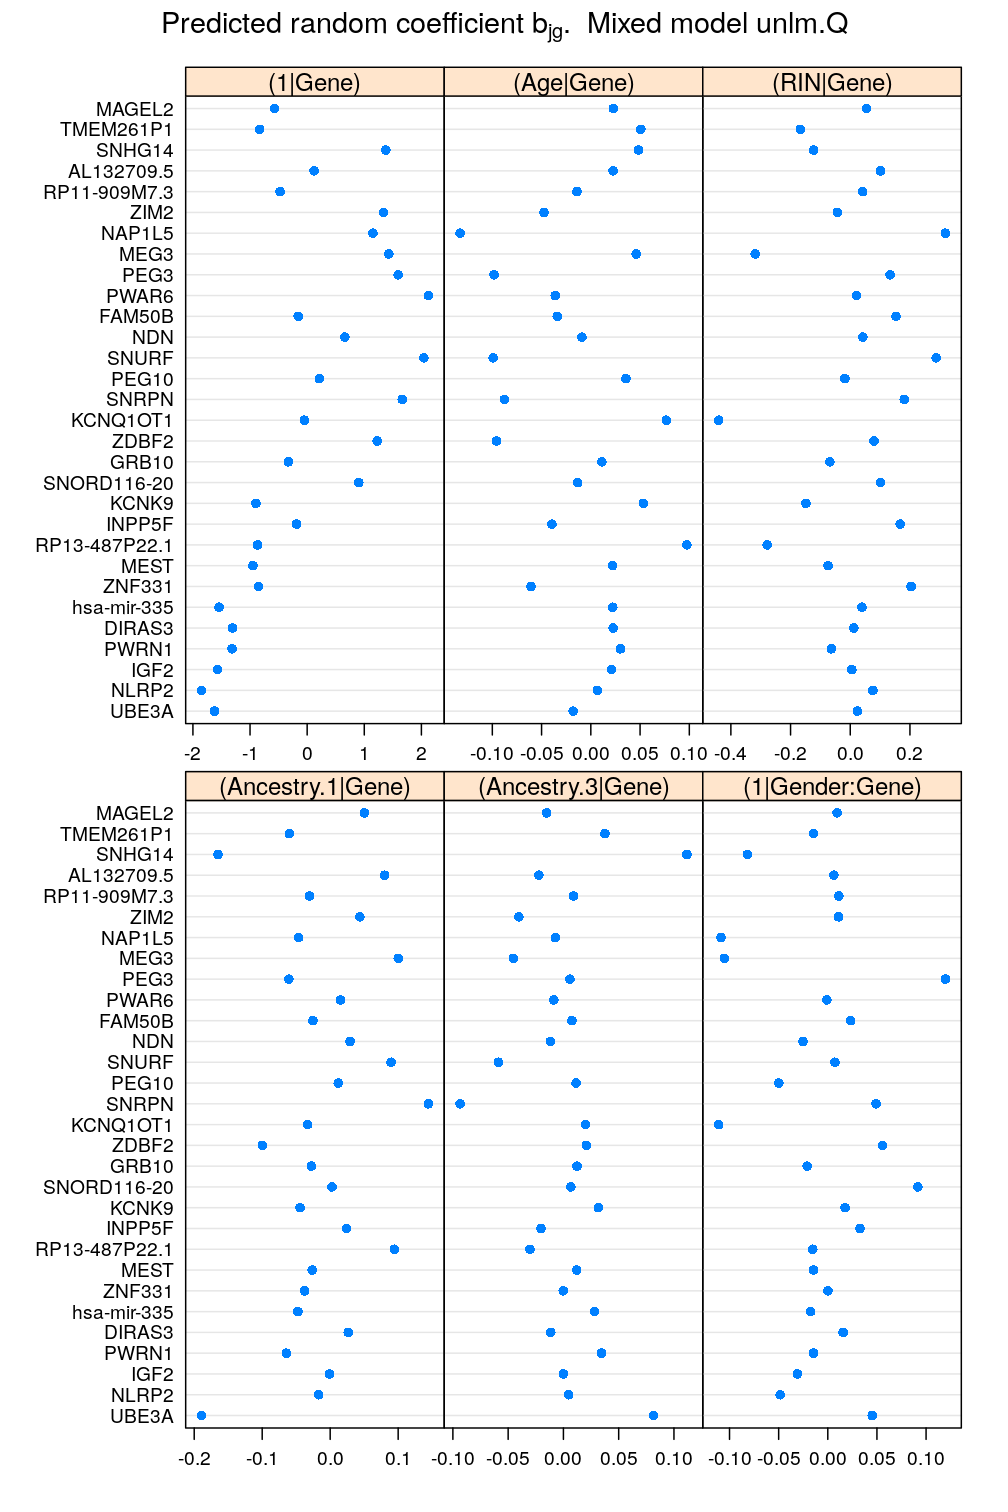
This figure summarizes the most important results and is meant for the manuscript. The panel named as (1∣Gender:Gene) presents the difference between the coefficient for Male and that for Female for each gene: b(k)gMale−b(k)gFemale, say, where g is a given gene and k in the superscript identifies the batch of coefficients associated with (1∣Gender:Gene) .
mydotplot(rbind(get.coef(batch = "Gene", model = M5),
                contrast.coef(cf = get.coef("Gender:Gene"), e.var = "Gender")[[1]]),
          layout = c(3, 1))[c(1, 2, 6)]

mydotplot(rbind(get.coef(batch = "Gene", model = M5),
                contrast.coef(cf = get.coef("Gender:Gene"), e.var = "Gender")[[1]]),
          layout = c(3, 2))
