Improved graphical overview of data and results pertaining to the recently extended regression analysis and ANOVA
Prepare data
Dependence of S on certain variables
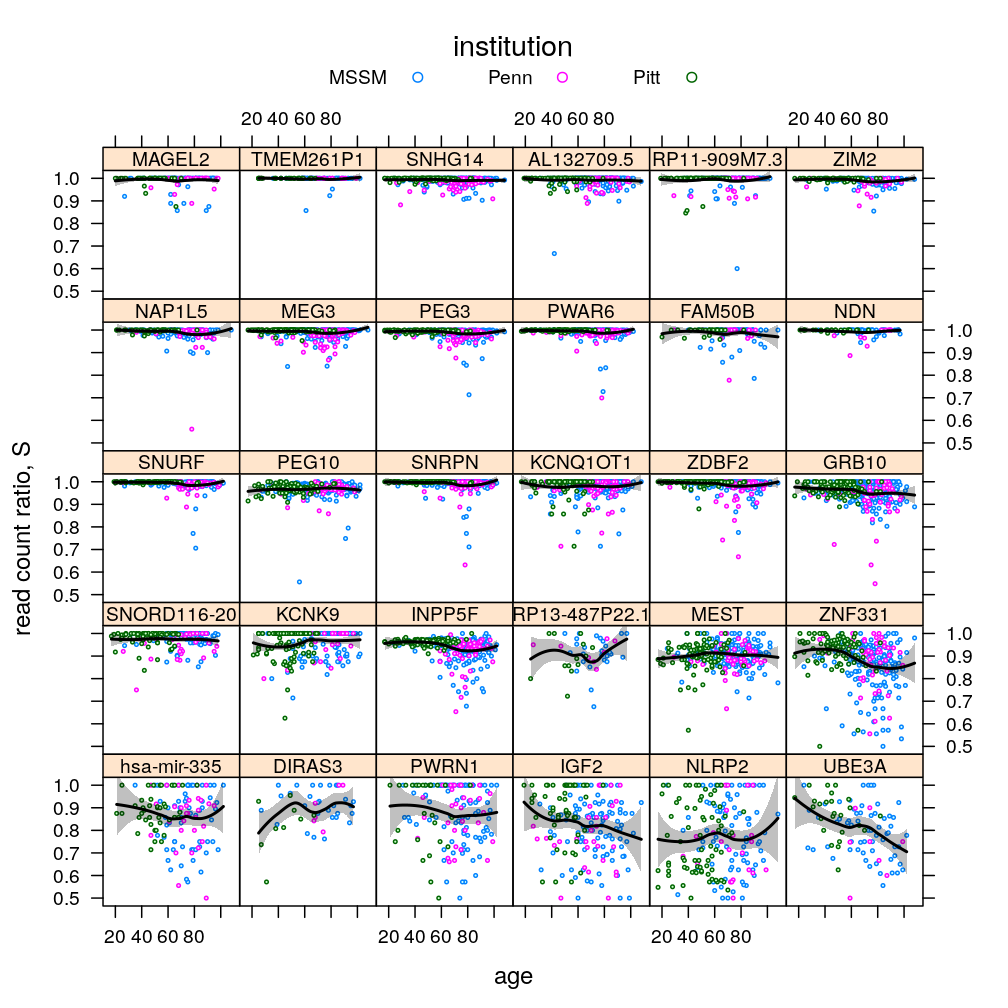
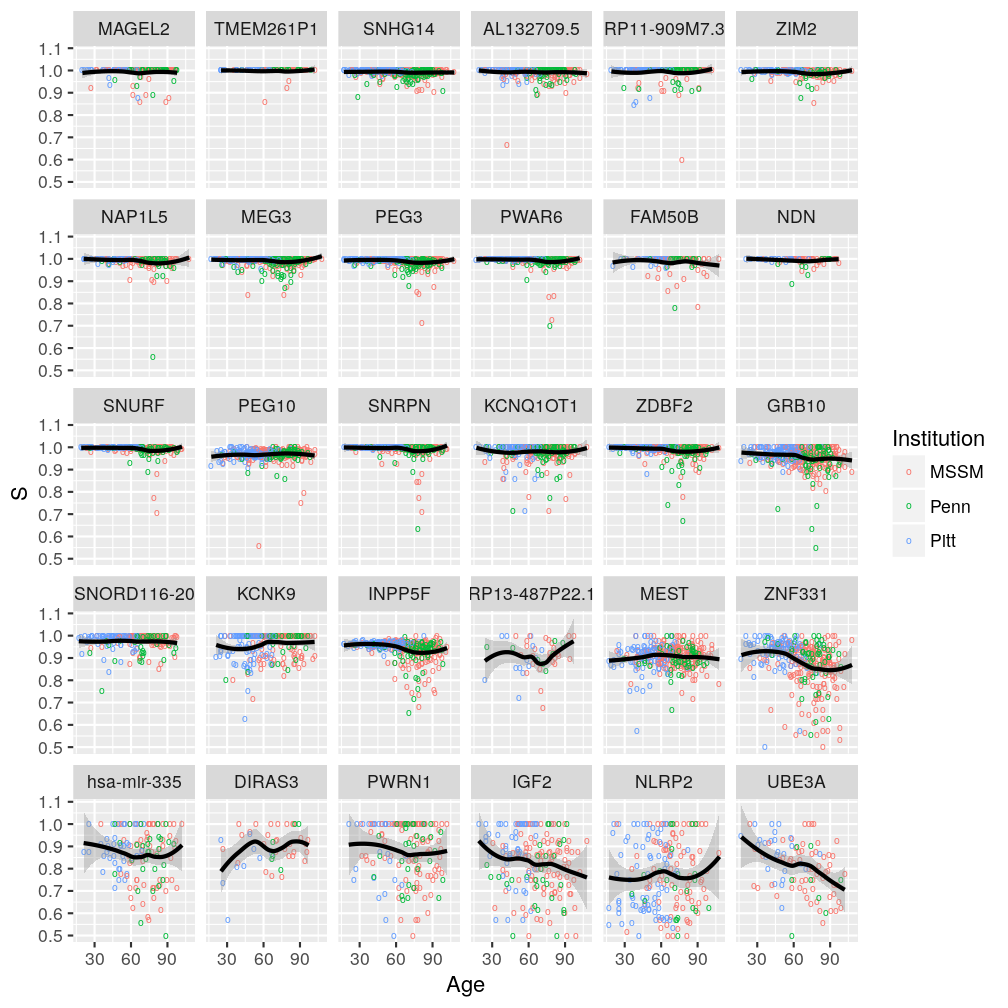
Dependence on gene, age, and institution
Implementation of the same plot both with the lattice and the ggplot2 package.
P <- list()
# lattice implementation
P$s.age.inst$lattice <-
    xyplot(S ~ Age | Gene, data = Y.long,
           subset = Gene %in% gene.ids,
           groups = Institution,
           panel = function(x, y, ...) {
               panel.xyplot(x, y, pch = 21, cex = 0.3, ...)
               panel.smoother(x, y, col = "black", lwd = 2, ...)
           },
           auto.key = list(title = "institution", columns = 3),
           par.settings = list(add.text = list(cex = 0.8)),
           ylab = "read count ratio, S",
           xlab = "age",
           aspect = "fill", layout = c(6, 5))
# ggplot2 implementation
g <- ggplot(data = Y.long, aes(x = Age, y = S))
g <- g + geom_point(pch = "o", aes(color = Institution))
g <- g + geom_smooth(method = "loess", color = "black")
g <- g + facet_wrap(~ Gene)
P$s.age.inst$ggplot2 <- g
plot(P$s.age.inst$lattice)
plot(P$s.age.inst$ggplot2)
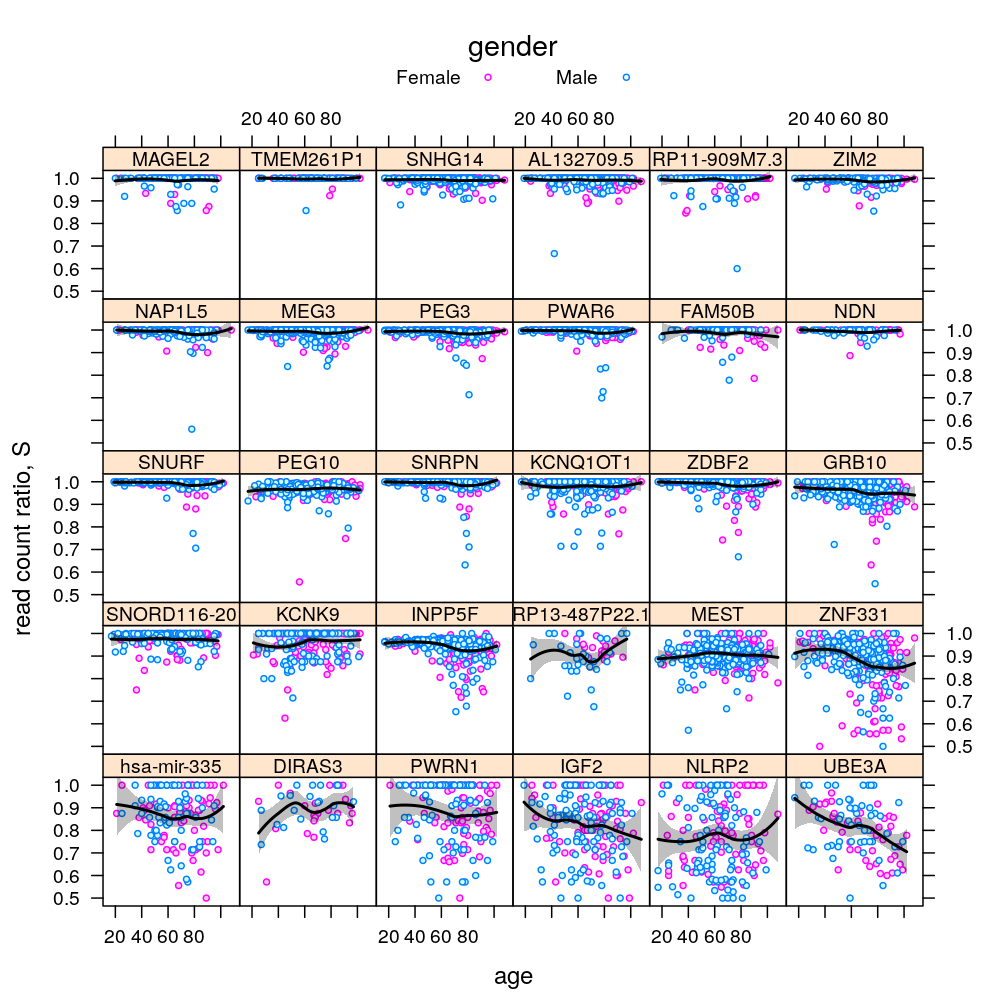
Gene, age, and gender
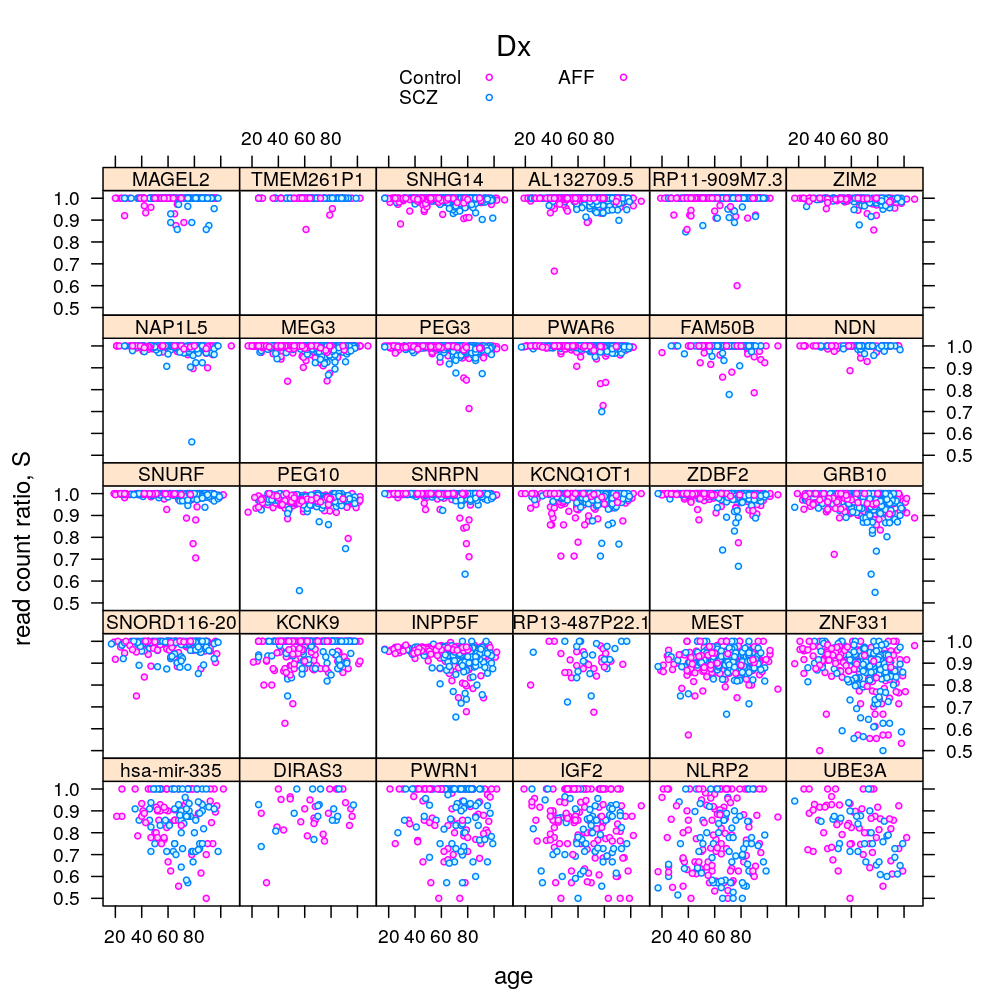
P <- list()
# lattice implementation
P$s.age.Dx$lattice <-
    xyplot(S ~ Age | Gene, data = Y.long, groups = Dx,
           subset = Gene %in% gene.ids,
           panel = function(x, y, ...) {
               panel.xyplot(x, y, pch = 21, ...)
               #panel.smoother(x, y, col = "black", lwd = 2, ...)
           },
           par.settings = list(add.text = list(cex = 0.8),
                               superpose.symbol = list(cex = 0.5,
                                                       fill = trellis.par.get("superpose.symbol")$fill[c(2, 1)],
                                                       col = trellis.par.get("superpose.symbol")$col[c(2, 1)])),
           auto.key = list(title = "Dx", columns = 2),
           ylab = "read count ratio, S",
           xlab = "age",
           aspect = "fill", layout = c(6, 5))
# ggplot2 implementation
g <- ggplot(data = Y.long, aes(x = Age, y = S))
g <- g + geom_point(pch = "o", aes(color = Dx))
g <- g + geom_smooth(method = "loess", color = "black")
g <- g + facet_wrap(~ Gene)
P$s.age.Dx$ggplot2 <- g
plot(P$s.age.Dx$lattice)
#plot(P$s.age.Dx$ggplot2)
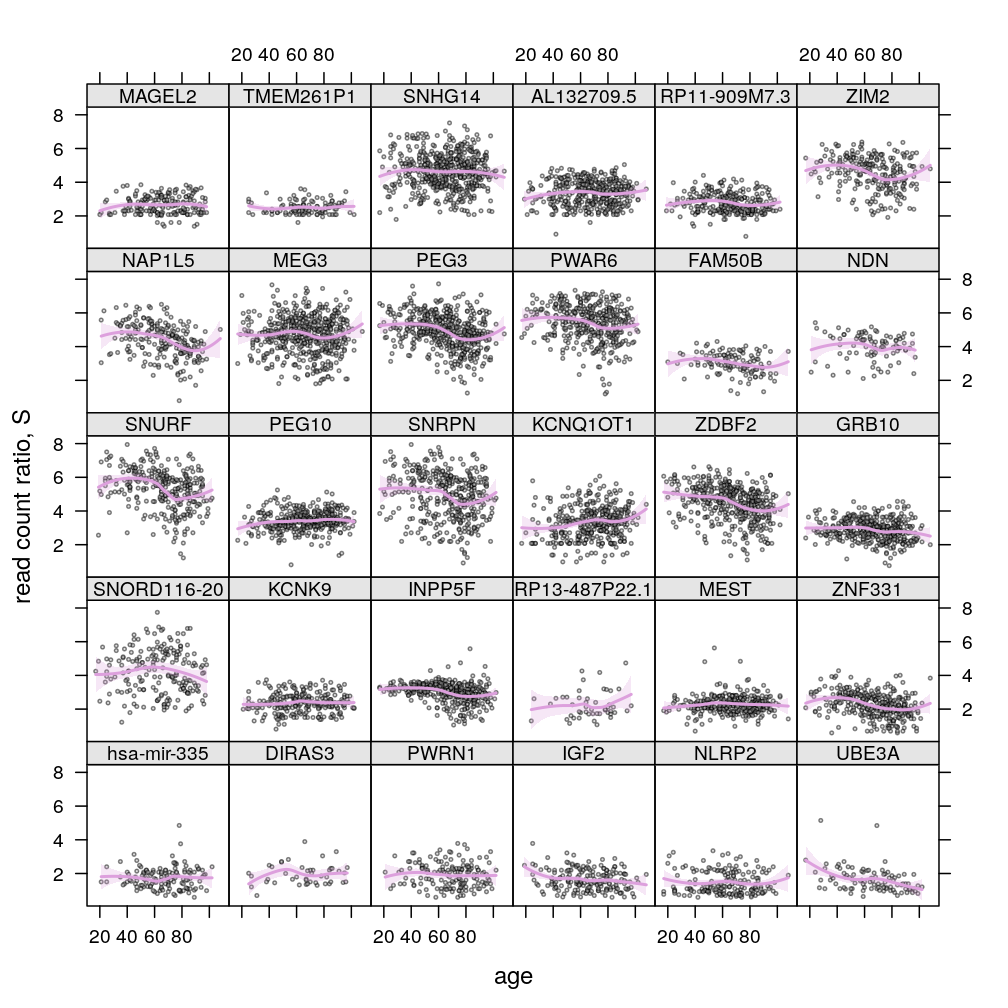
P$s.age$lattice <-
    xyplot(S ~ Age | Gene, data = Y.long,
           subset = Gene %in% gene.ids,
           par.settings = list(add.text = list(cex = 0.8),
                               strip.background = list(col = "gray90"),
                               plot.symbol = list(pch = 21, cex = 0.5, col = "black", fill = "gray", alpha = 0.5)),
           auto.key = list(title = "gender", columns = 2),
           panel = function(x, y, ...) {
               panel.xyplot(x, y, pch = 21, cex = 0.3, ...)
               panel.smoother(x, y, col = "plum", lwd = 2, ...)
           },
           ylab = "read count ratio, S",
           xlab = "age",
           aspect = "fill", layout = c(6, 5))
plot(P$s.age$lattice)
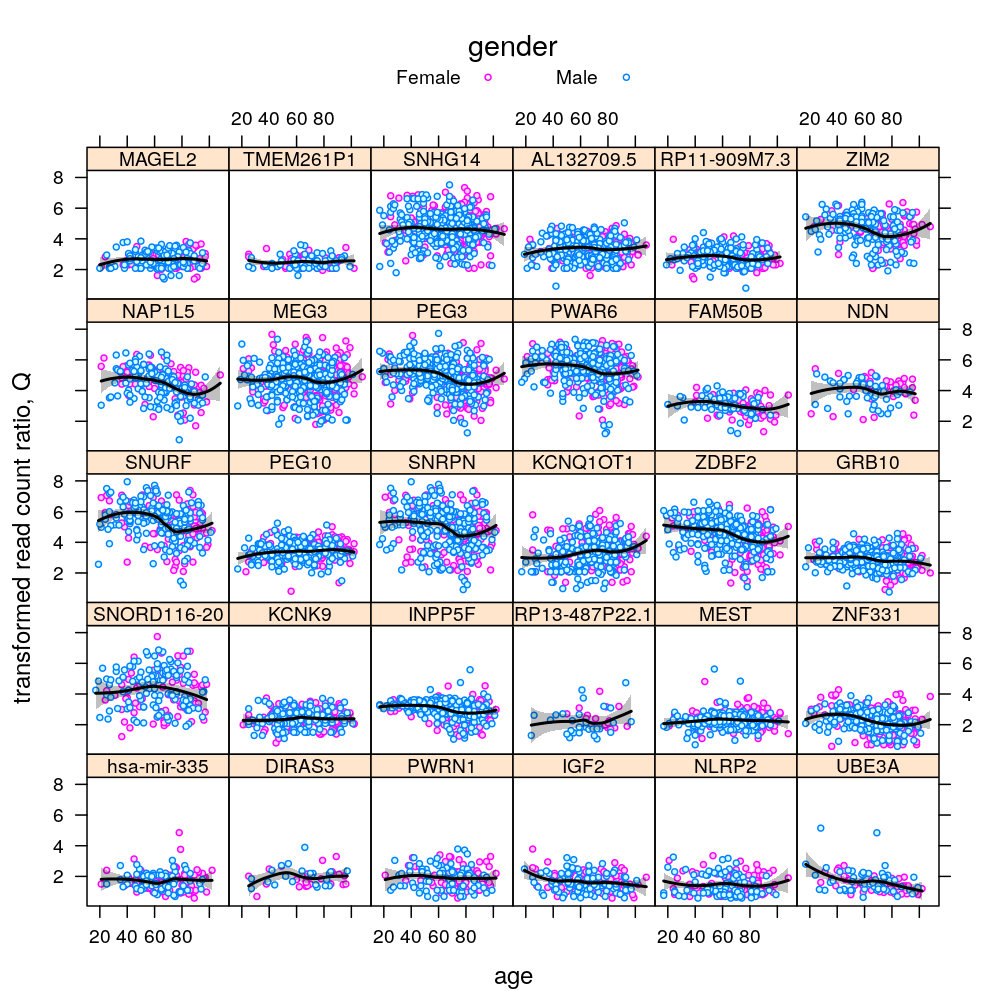
P$s.age$lattice <-
    xyplot(Q ~ Age | Gene, data = Y.long,
           subset = Gene %in% gene.ids,
           par.settings = list(add.text = list(cex = 0.8),
                               strip.background = list(col = "gray90"),
                               plot.symbol = list(pch = 21, cex = 0.5, col = "black", fill = "gray", alpha = 0.5)),
           auto.key = list(title = "gender", columns = 2),
           panel = function(x, y, ...) {
               panel.xyplot(x, y, pch = 21, cex = 0.3, ...)
               panel.smoother(x, y, col = "plum", lwd = 2, ...)
           },
           ylab = "read count ratio, S",
           xlab = "age",
           aspect = "fill", layout = c(6, 5))
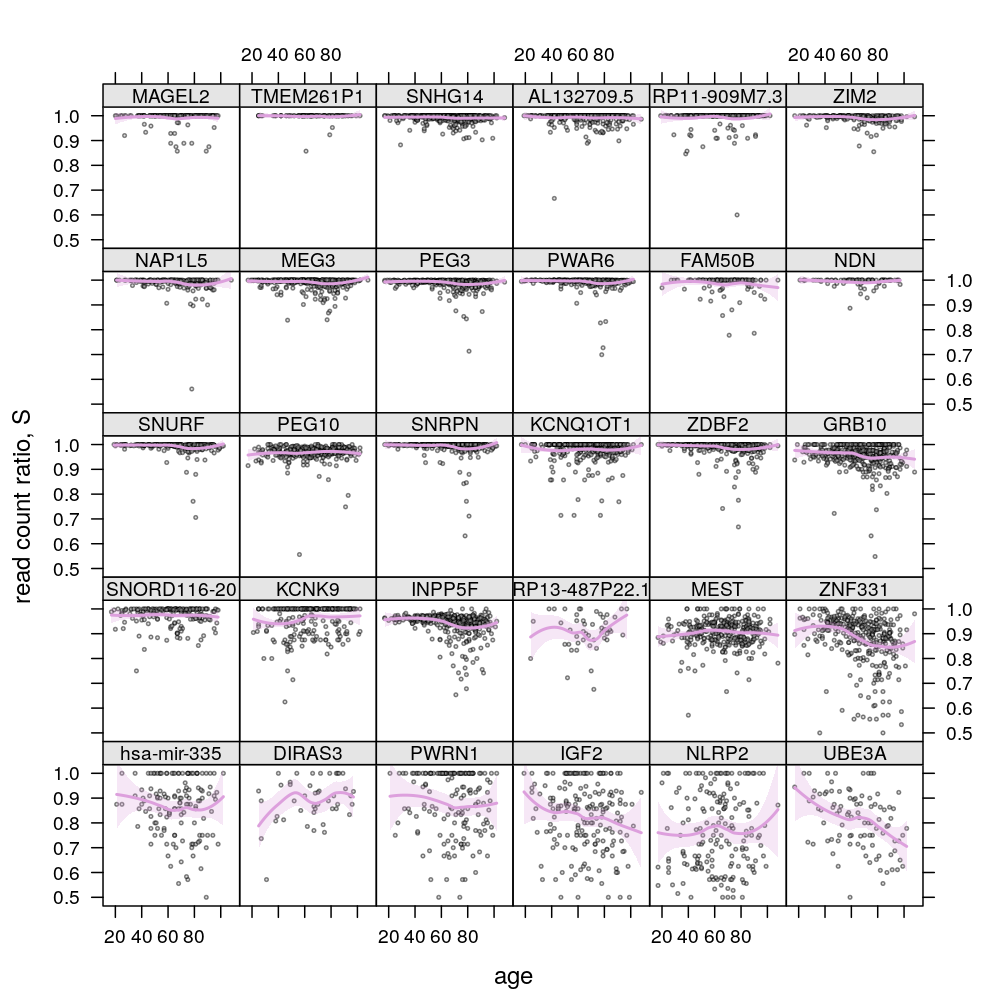
plot(P$s.age$lattice)
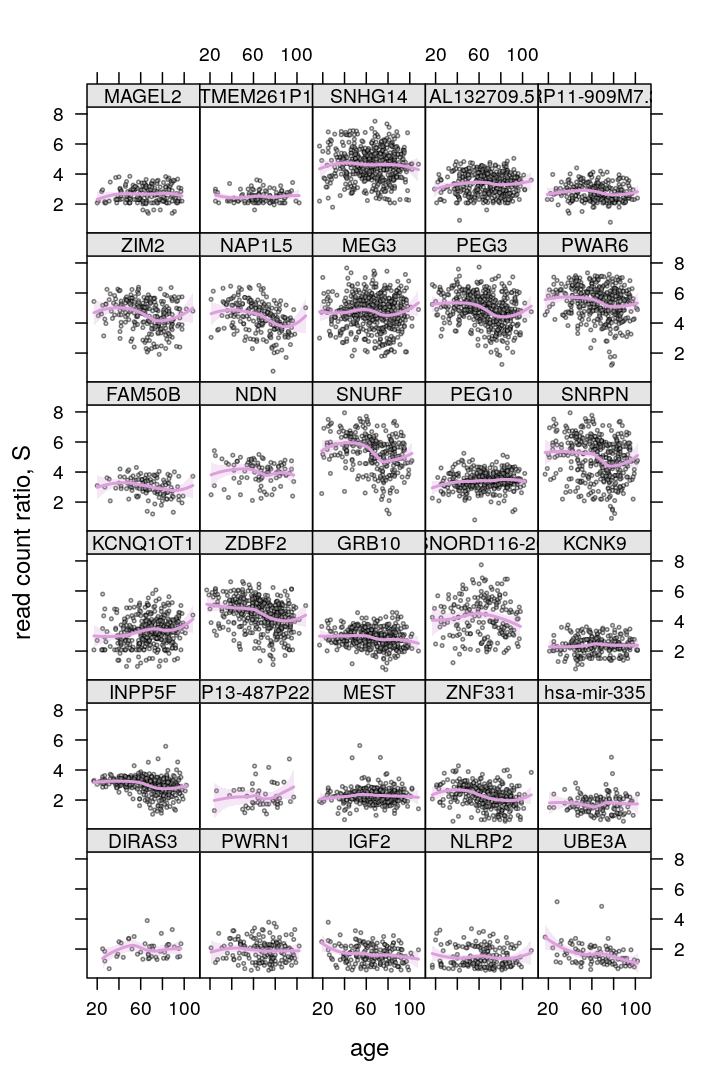
update(P$s.age$lattice, layout = c(5, 6))
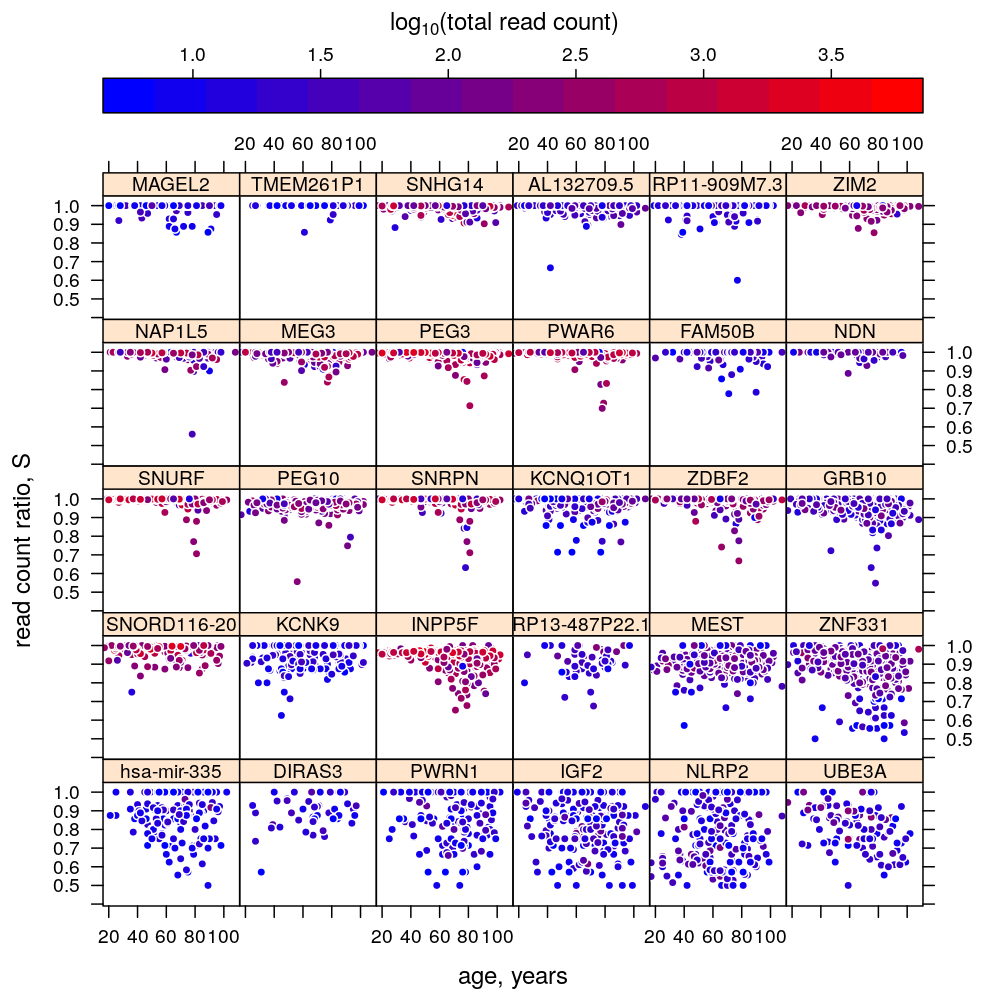
Dependence on gene, age, and total read count N

Associations between explanatory variables
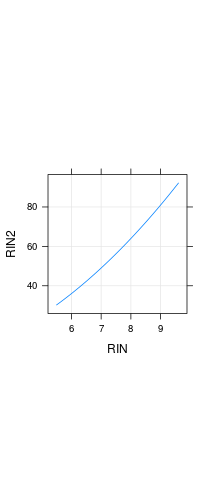
Deterministic association: RIN and RIN2

Stochastic (statistical) associations
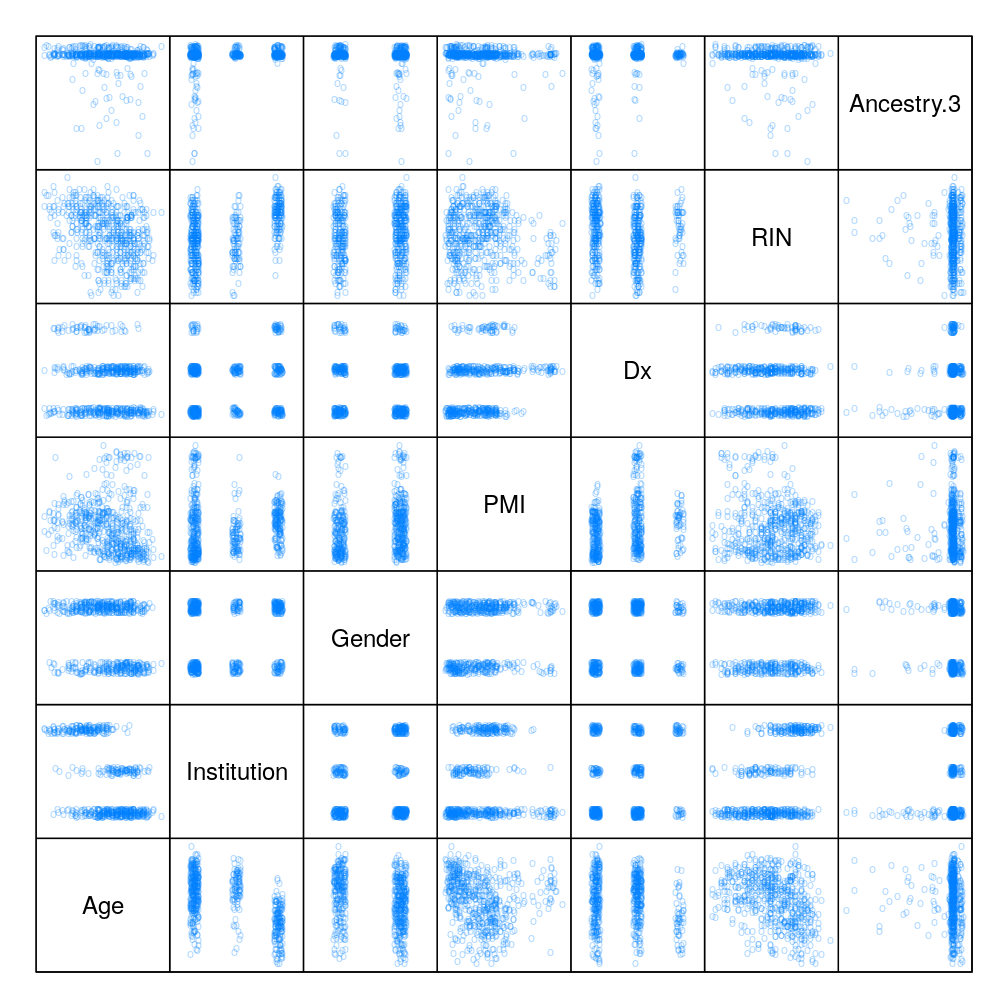
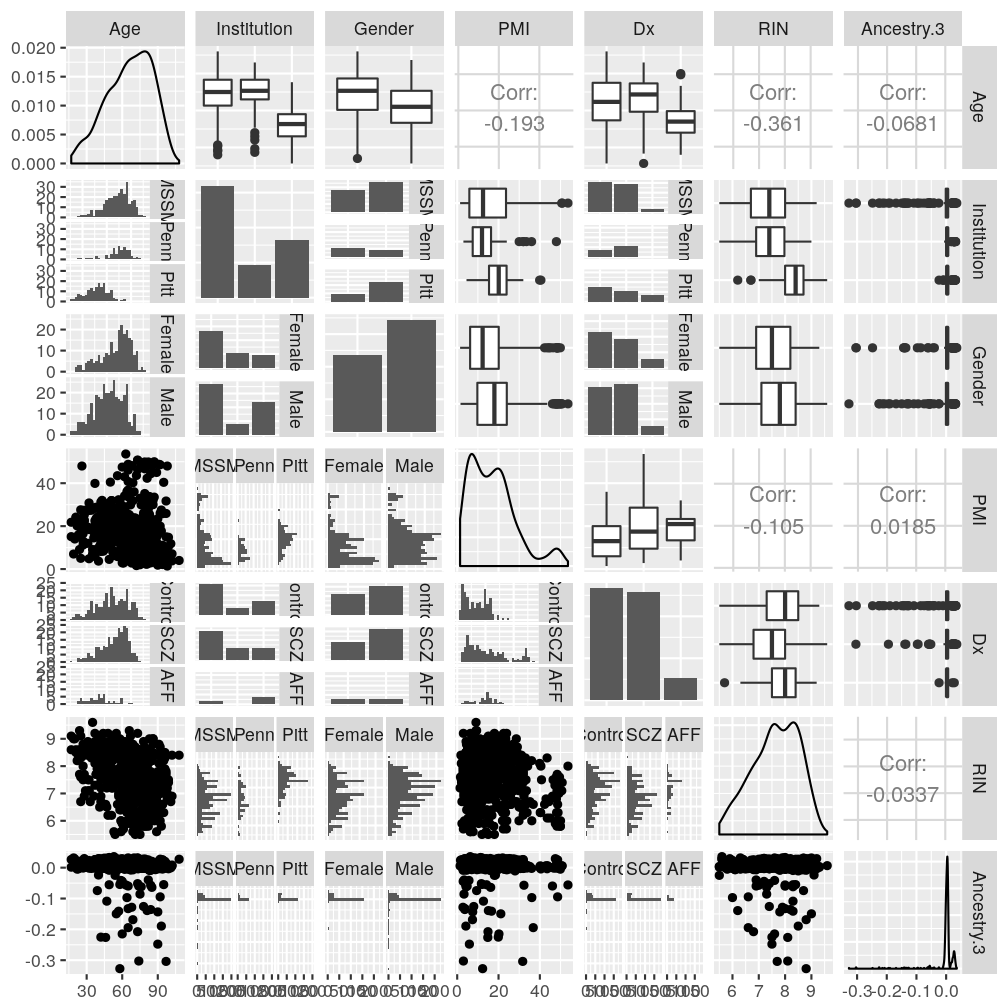
Both “scatter plot matrices” show the same set of pairwise associations (top: lattice, bottom: ggplot2 and GGally packages).
