Introduction
Listen to Jimi's song. Subscribe to this blog via RSS. Let's get experienced!
R you experienced in
- statistics and machine learning?
- model fitting and selection?
- representing math structures in R?
- R functions and enclosing environments?
- abstractions with higher order functions?
- (non)standard evaluation of R expressions?
About me
I am a postdoctoral researcher in statistical genetics at Mount Sinai School of Medicine, New York. Besides but not unrelated to that I work on side projects similar to this blog to explore other subjects in statistics and computer programming. You can see and hear my peculiar Hungarian name on Forvo and visit me on LinkedIn.
Articles
Hover above an ![]() symbol to reveal
abstract. Click to read whole article.
symbol to reveal
abstract. Click to read whole article.
Classification
Oct 17, 2017
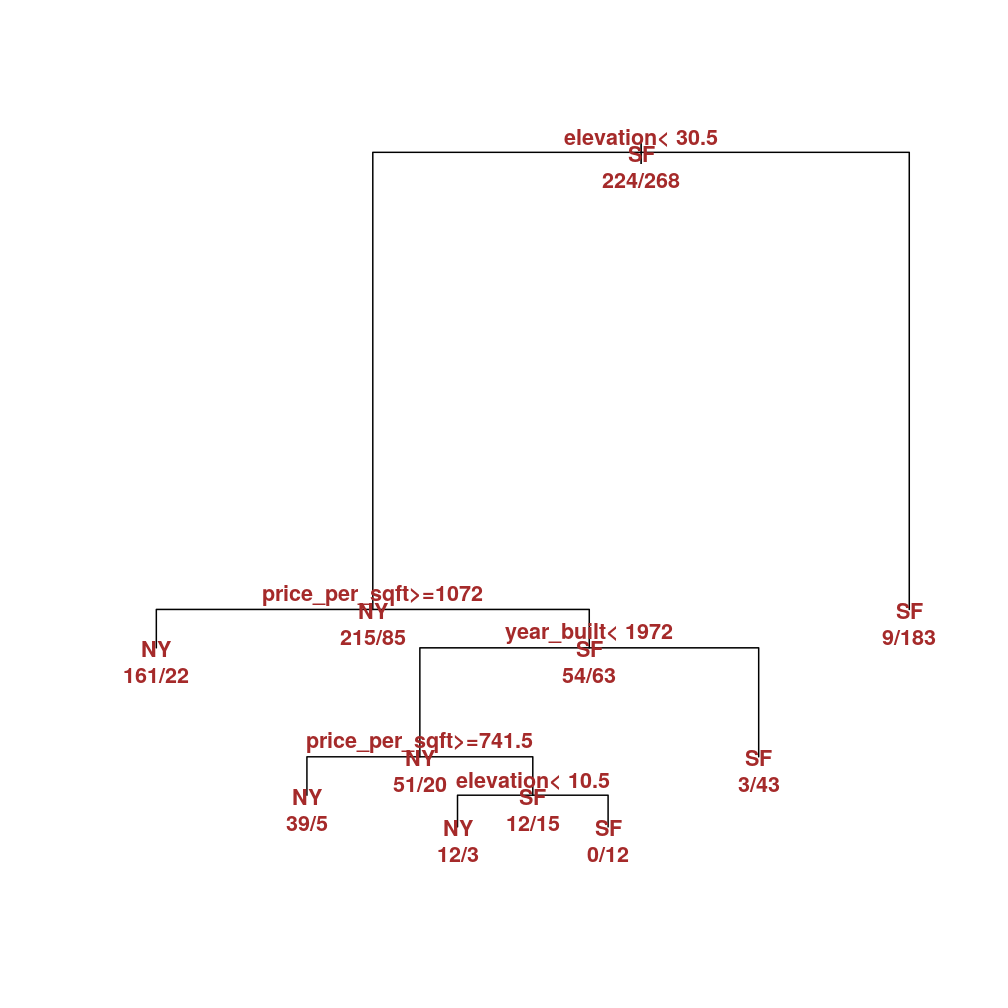
Decision tree model is fitted to toy data on homes in New York and San Francisco (NY, SF). Along the way overfitting is illustrated. The optimally fitted tree is used to classify some test data as either NY or SF.
Fixed and Mixed Regression Models
Oct 16, 2017
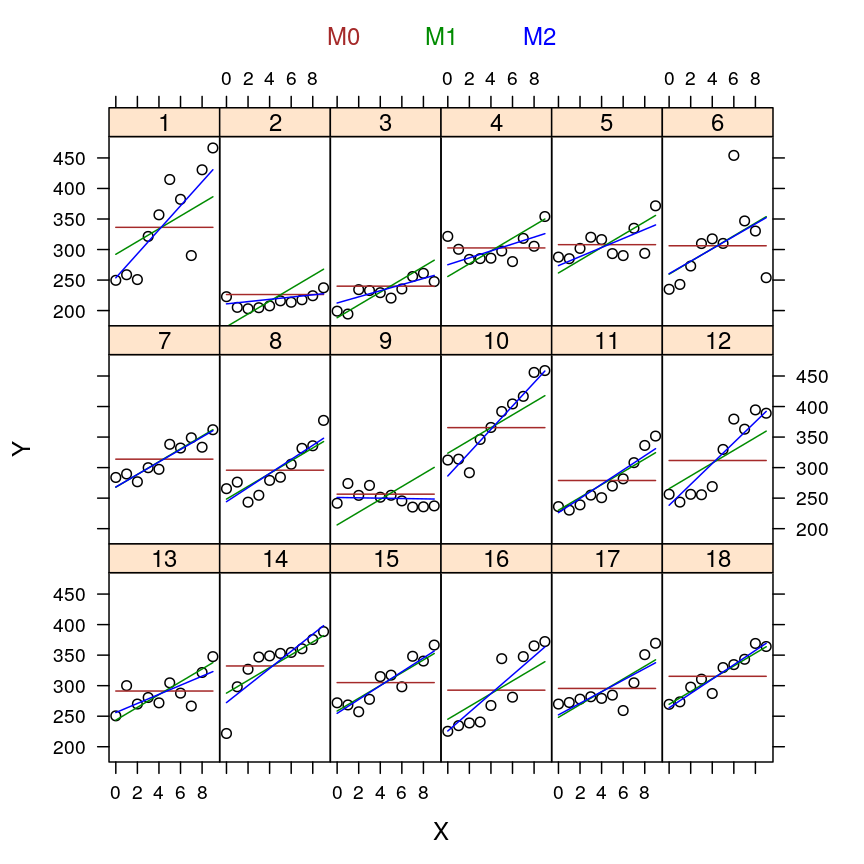
Fixed and mixed models are fitted to the sleepstudy dataset to investigate how human reaction slows down with sleep deprivation.
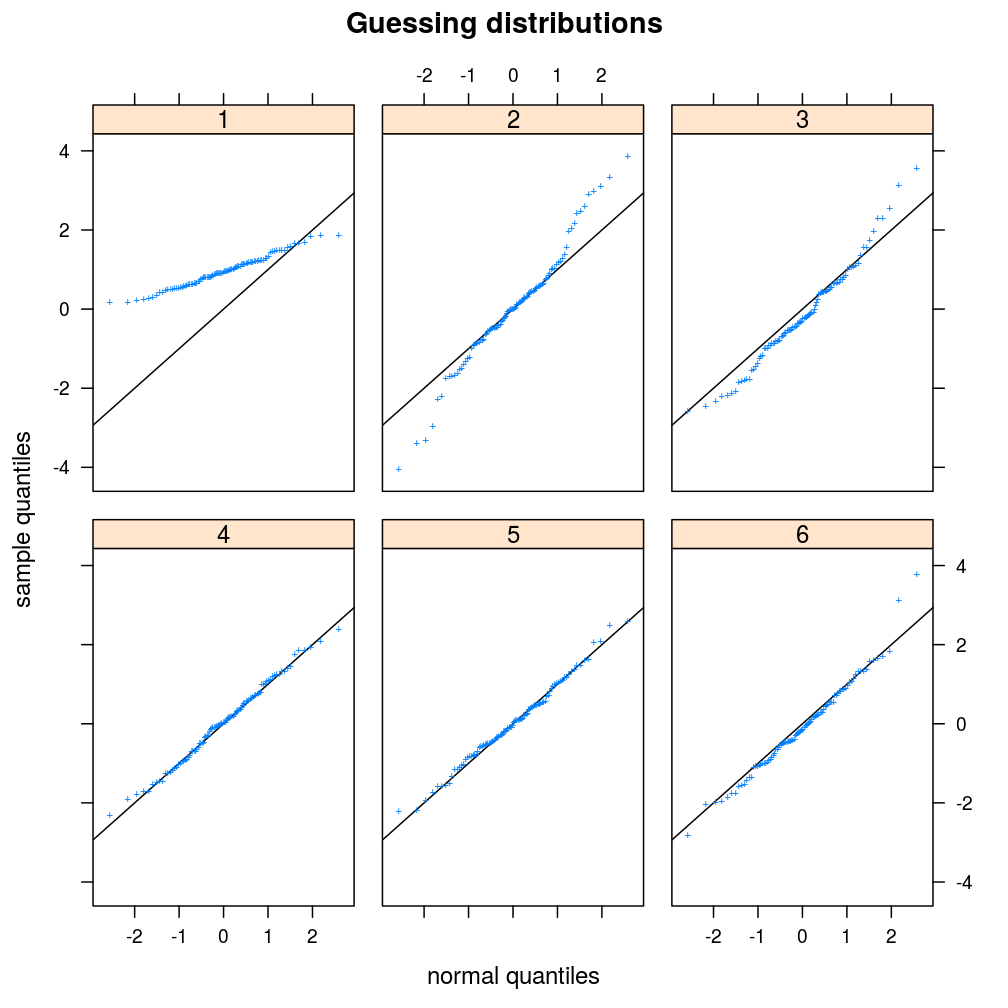
Substitution vs Switch
Nov 20, 2016
- general task: evaluate arbitrary elements of a sequence of expressions
- specific task: produce normal Q–Q plots for a sequence of distributions
- two implementation strategies are discussed: one based on
switchand another onsubstitute - using
substitutedemands more abstract programming but affords more flexibility
Iteration: Loops vs Functional Programming
Aug 13, 2016
Iterative processes are characterized by successive steps forming a sequence of states captured by state variables. In each step the state variables are updated based on themselves and some rule. Iteration is often implemented using control-flow constructs like the for or while loop (see ?Control for help).
Reshaping Data from Longitudinal and Factorial Experiments
Jul 14, 2016
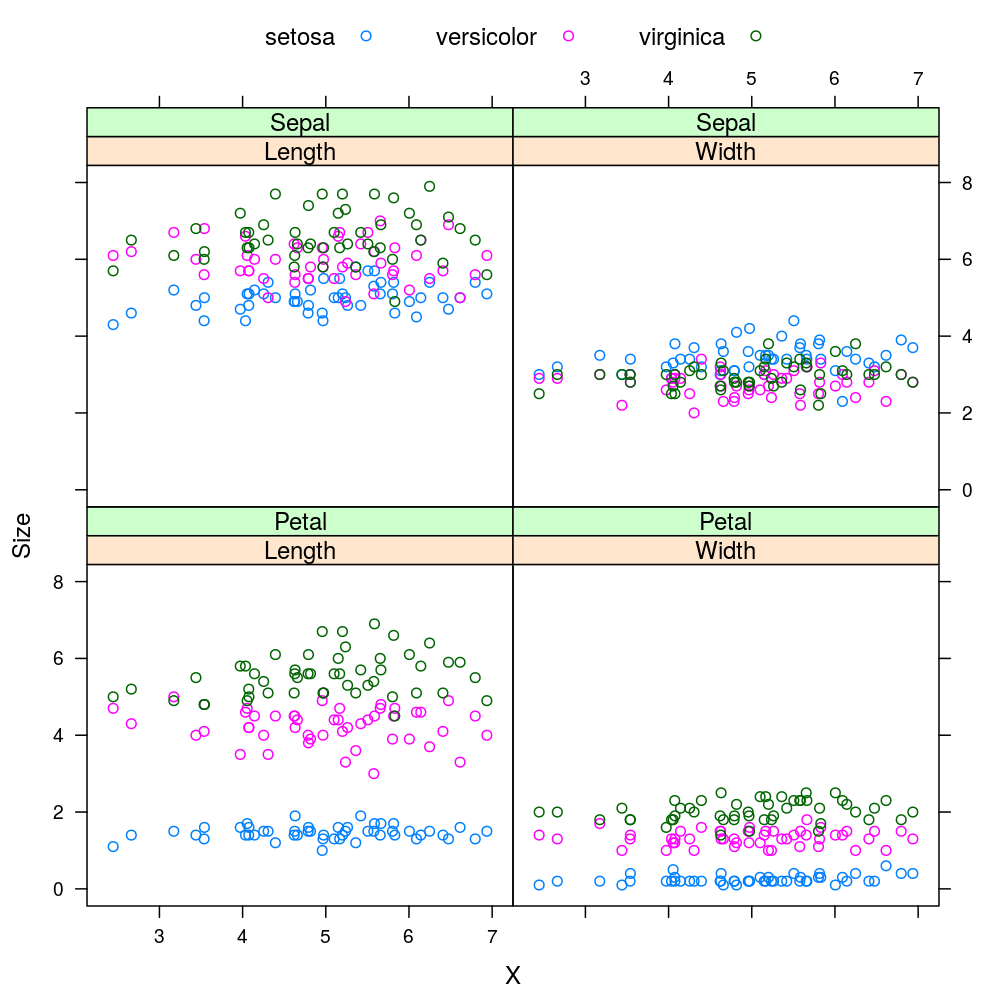
Graphic packages like lattice and ggplot2 work best when data are presented in long format as opposed to wide format into which data are typically imported and in which it is usually convenient to perform calculations. For example morley is a data frame in long format, which allows functions like lattice::xyplot to receive simple formulas and yet produce a complex trellis display.