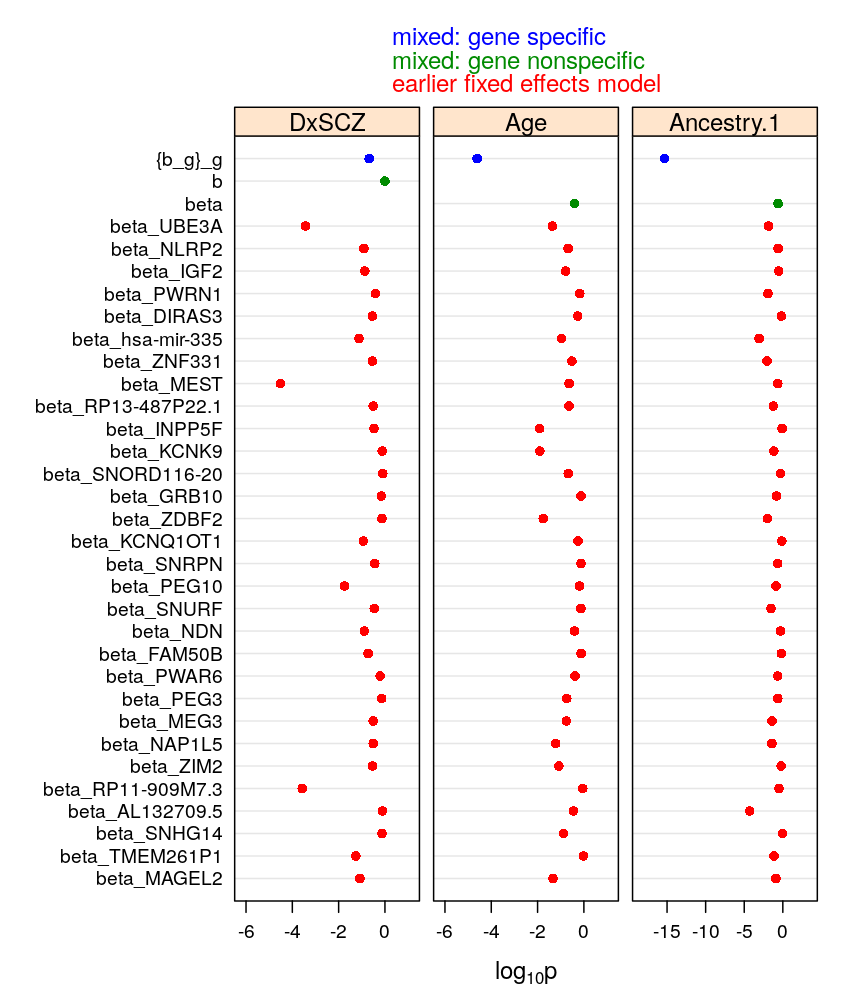
p values from fixed and mixed models
Feb 10, 2018
This article was motivated by my Work In Progress (WIP) seminar on 2/14/2018 for the Department of Genetics and Genomic Sciences at Mount Sinai. The figures are used in the corresponding presentation (2018-02-01-monoall-general.pdf).
Data Table For Regression
Feb 02, 2018
This article produces a data table for presentation purposes (see results/data-table-for-regression.csv). Note that these data were used for previous regression analyses.
Mixed Model Coefs
Jul 31, 2017
![Predict random regression coefficients of the mixed effect model M5 (the best fitting model). This uses the ranef function of the lme4 R package. As the documentation says: “[ranef is a] generic function to extract the conditional modes of the random effects from a fitted model object. For linear mixed models the conditional modes of the random effects are also the conditional means.”](/monoallelic-brain-notebook/projects/monoallelic-brain/R/2017-07-31-mixed-model-coefs/figure/ranef-gender-gender-gene-m5-1.png)
Predict random regression coefficients of the mixed effect model M5 (the best fitting model). This uses the ranef function of the lme4 R package. As the documentation says: “[ranef is a] generic function to extract the conditional modes of the random effects from a fitted model object. For linear mixed models the conditional modes of the random effects are also the conditional means.”
Ms Revision
Jul 17, 2017
Sequential versions of the manuscript in PDF format as well as checklist for revision to Nature Communications.
Mixed Model Todo
Mar 10, 2017
Summary of planned tasks for the completion of this research project.
Model Checking
Mar 08, 2017
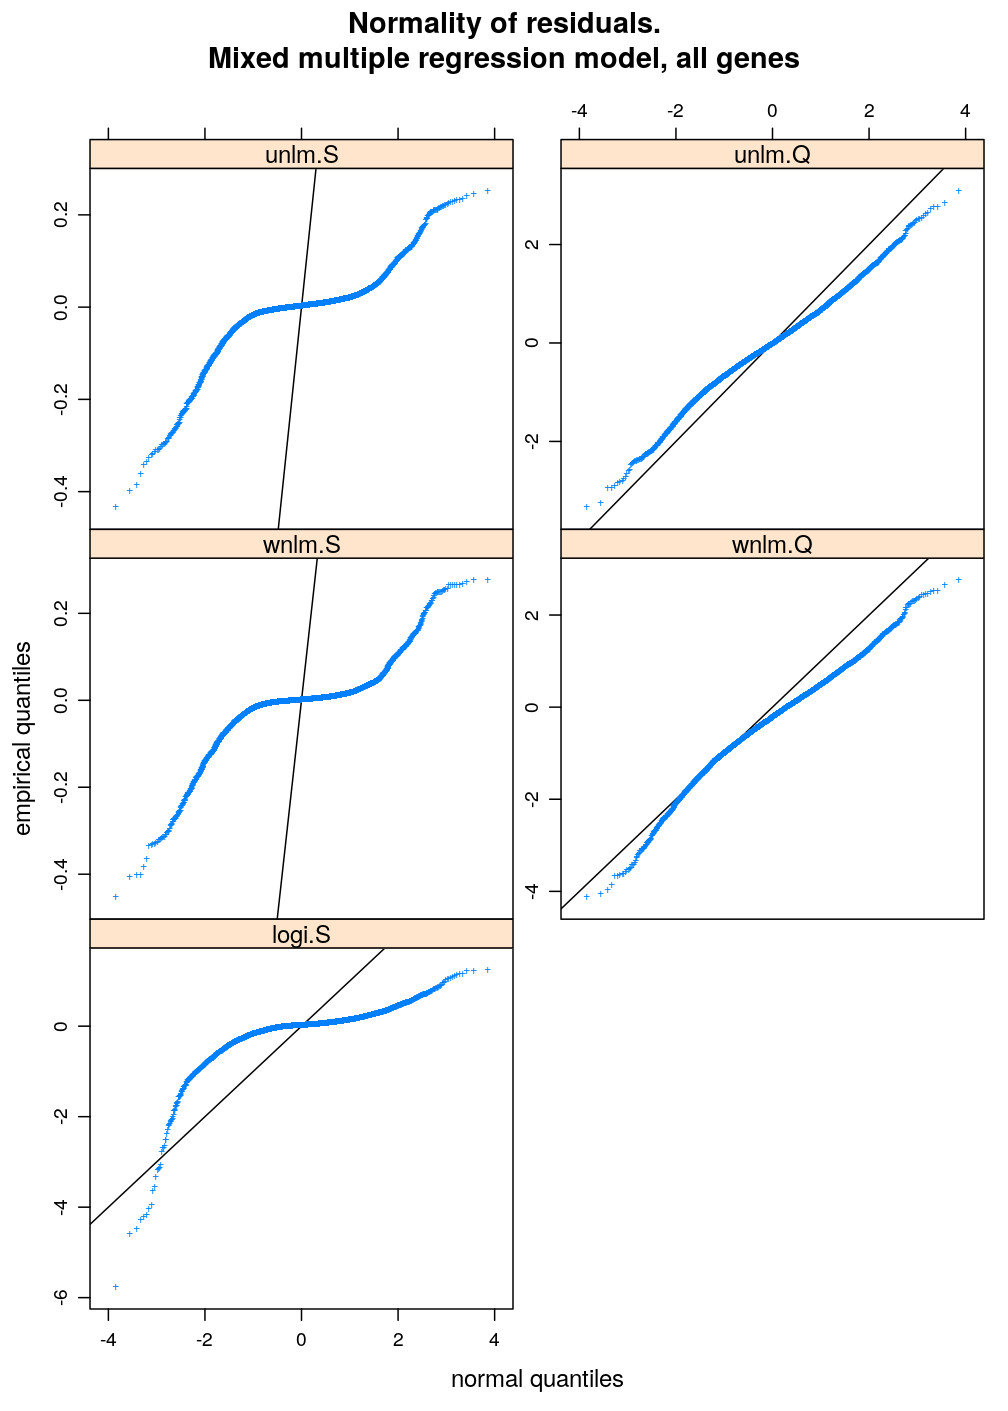
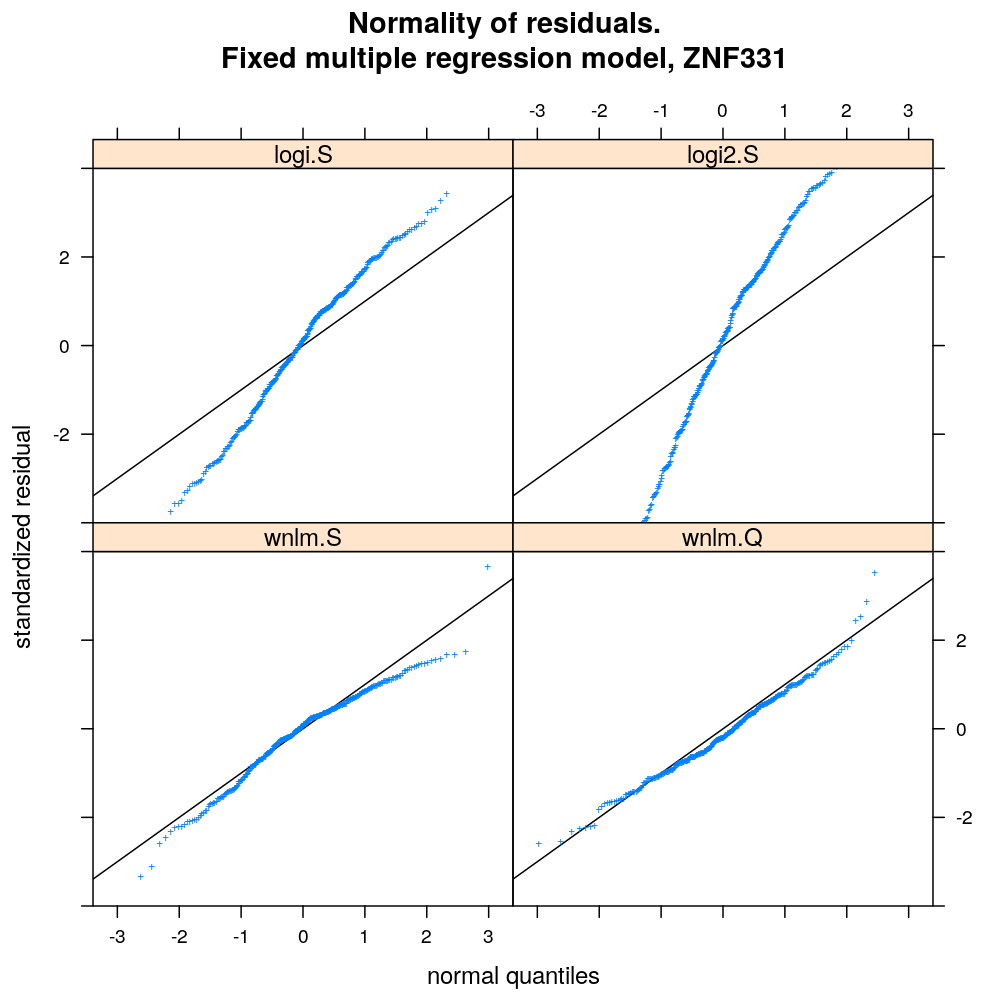
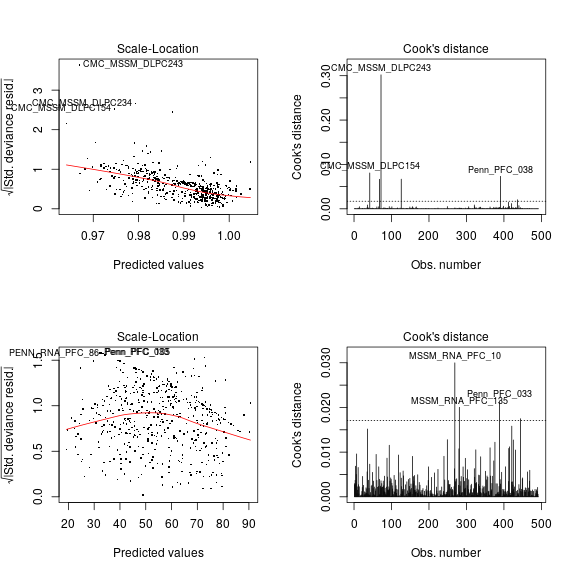
Two characteristics of fit are checked for a set of models: (1) normality of residuals and (2) homogeneity of error variance. These are evaluated with diagnostic plots. Among the checked models the best fitting one is unlm.Q and wnlm.Q regardless of the terms in the linear predictor. However, the fit of wnlm.Q converges very slowly or fails to converge especially when more terms are present in the linear predictor.
Joint Model
Mar 06, 2017
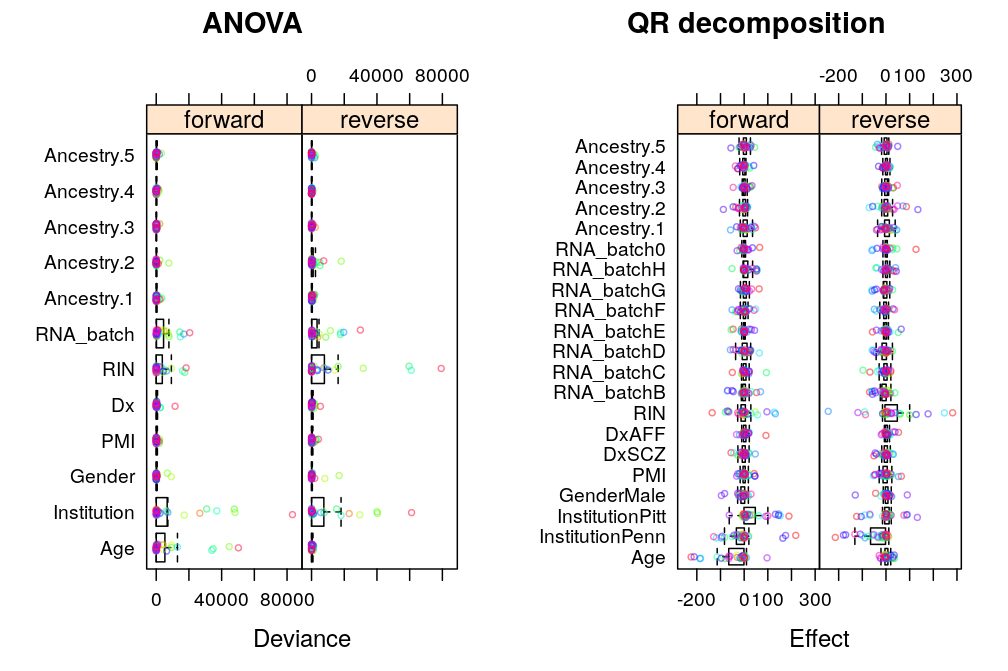
An ad-hoc forward model selection strategy is used to evaluate the effect of the terms of the linear predictor in mixed effects models. A strongly reduced starting model is prompted by earlier analysis using linear models conditioned on genes. The model space is explored using that prior knowledge combined with information criteria (BIC and AIC) and likelihood ratio test. The biologically interesting finding is that Ancestry.1, Ancestry.3 and Age have significant gene-specific effects but no gene-independent effects. Dx (schizophrenia) has neither gene-specific nor gene-independent effect.
Mixed Model Demo Using the lme4 Package
Mar 01, 2017
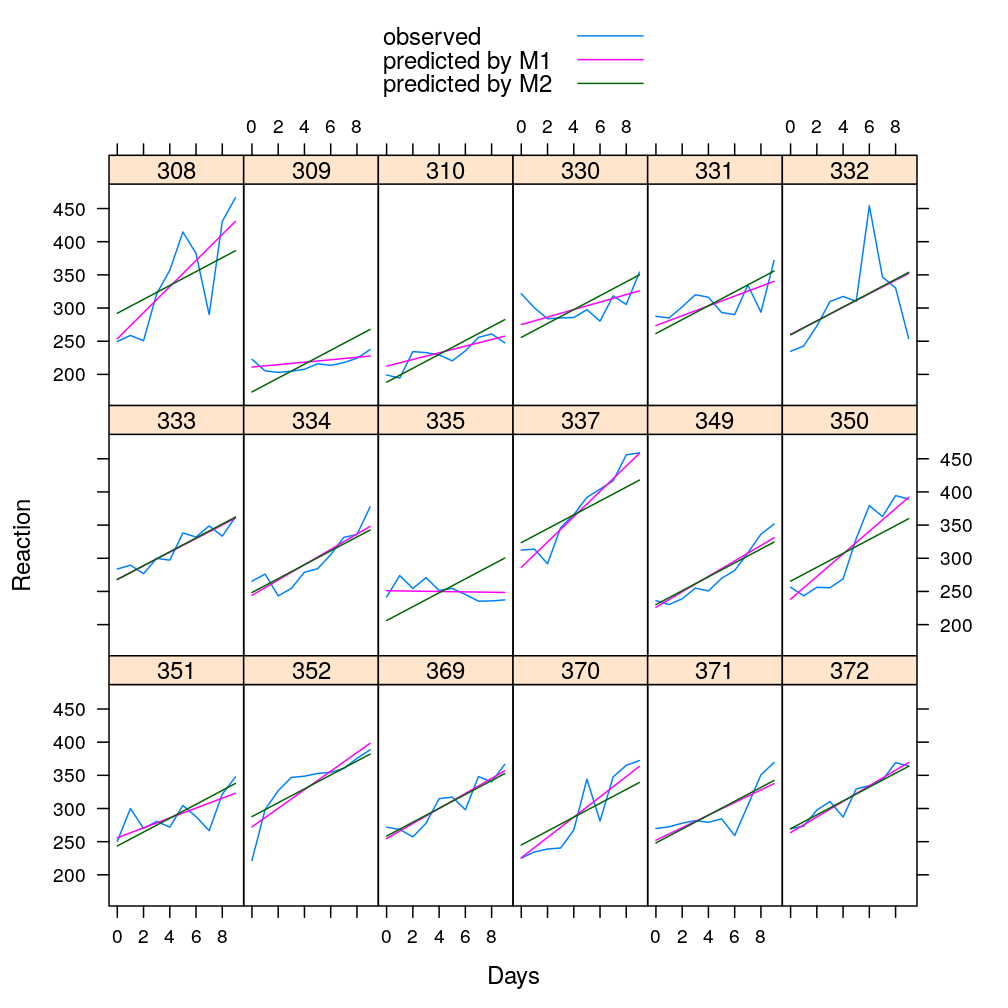
The advantage of linear mixed models is demonstrated on a toy data (sleepstudy, bundled with R), in which study individuals act as grouping factors instead of genes. The mixed model is global in the sense that it may be fitted to the entire dataset covering all groups jointly. This is contrasted with local models fitted separately to each group, which is less powerful and tends to over fit the data. The mixed model is also contrasted with a fixed global model, in which the groups (individuals, genes) all have the same effect on the response or on the dependence of the response on predictors of potential interest.
Beta From Mixed Model
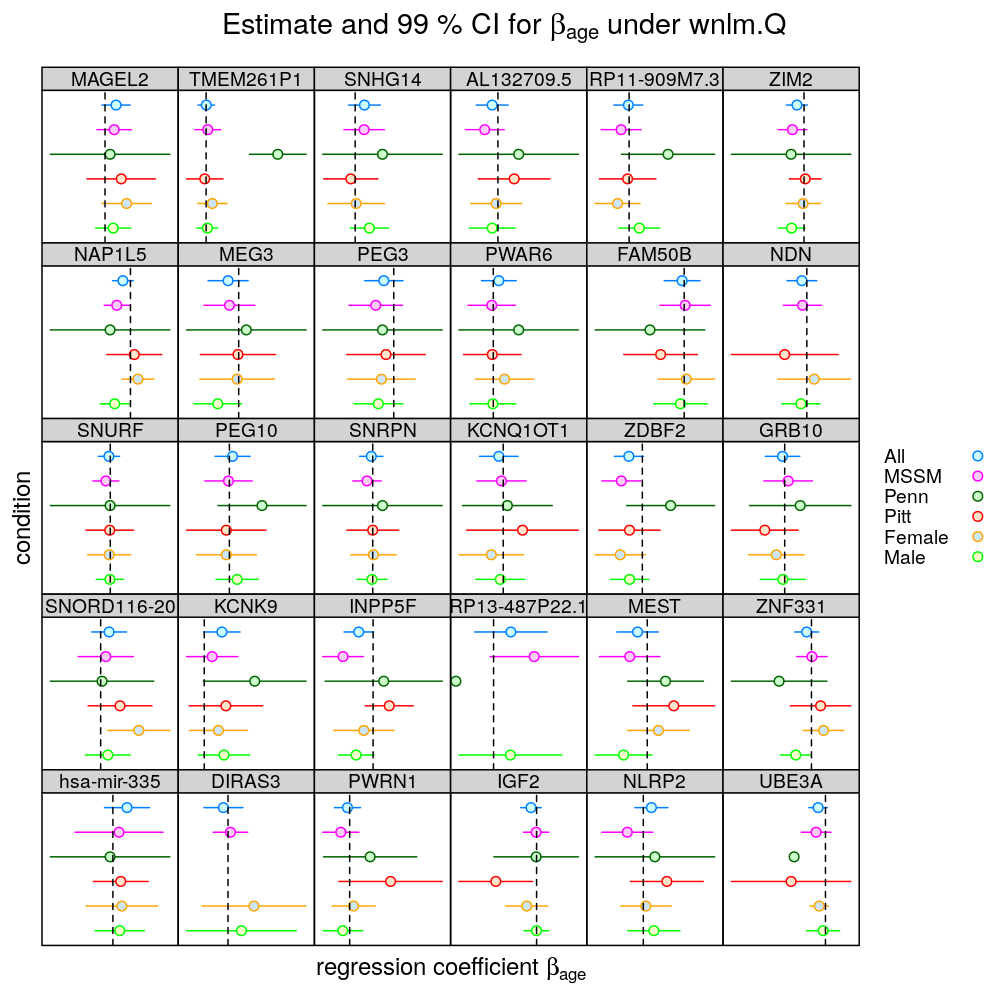
Feb 14, 2017

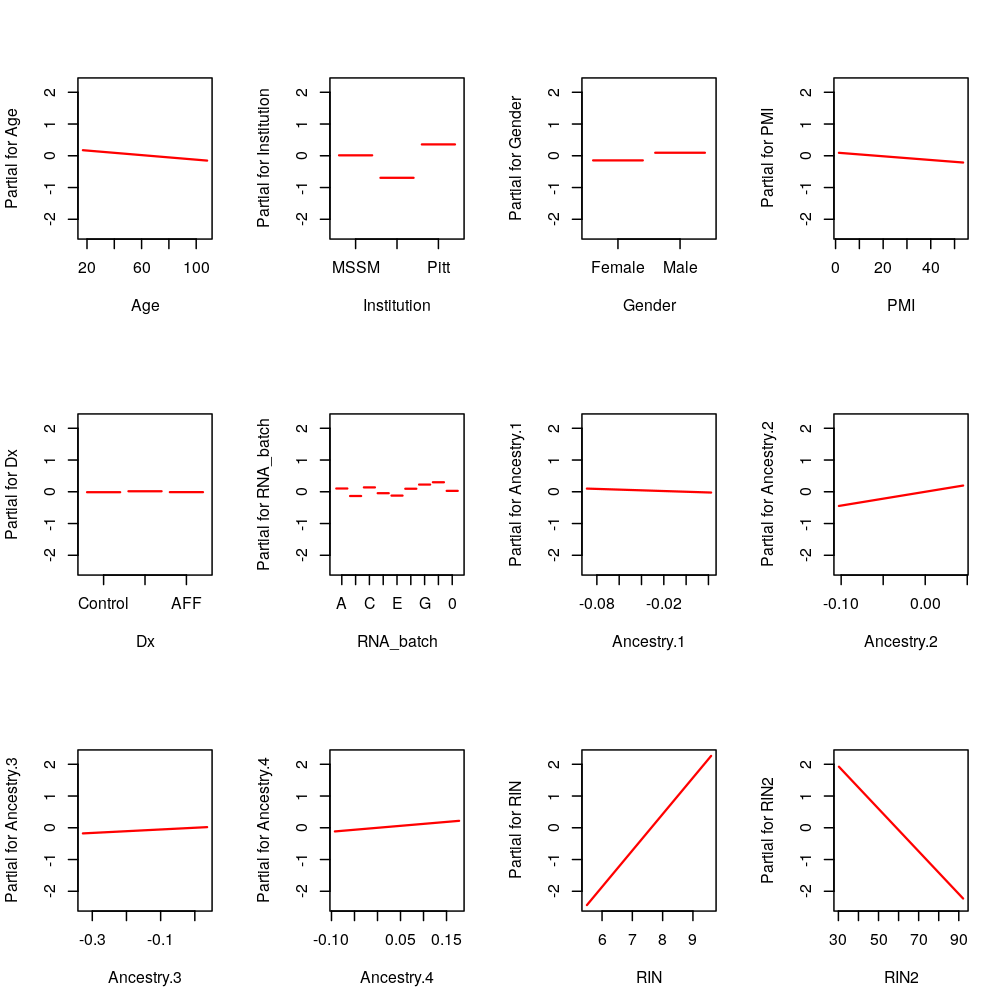
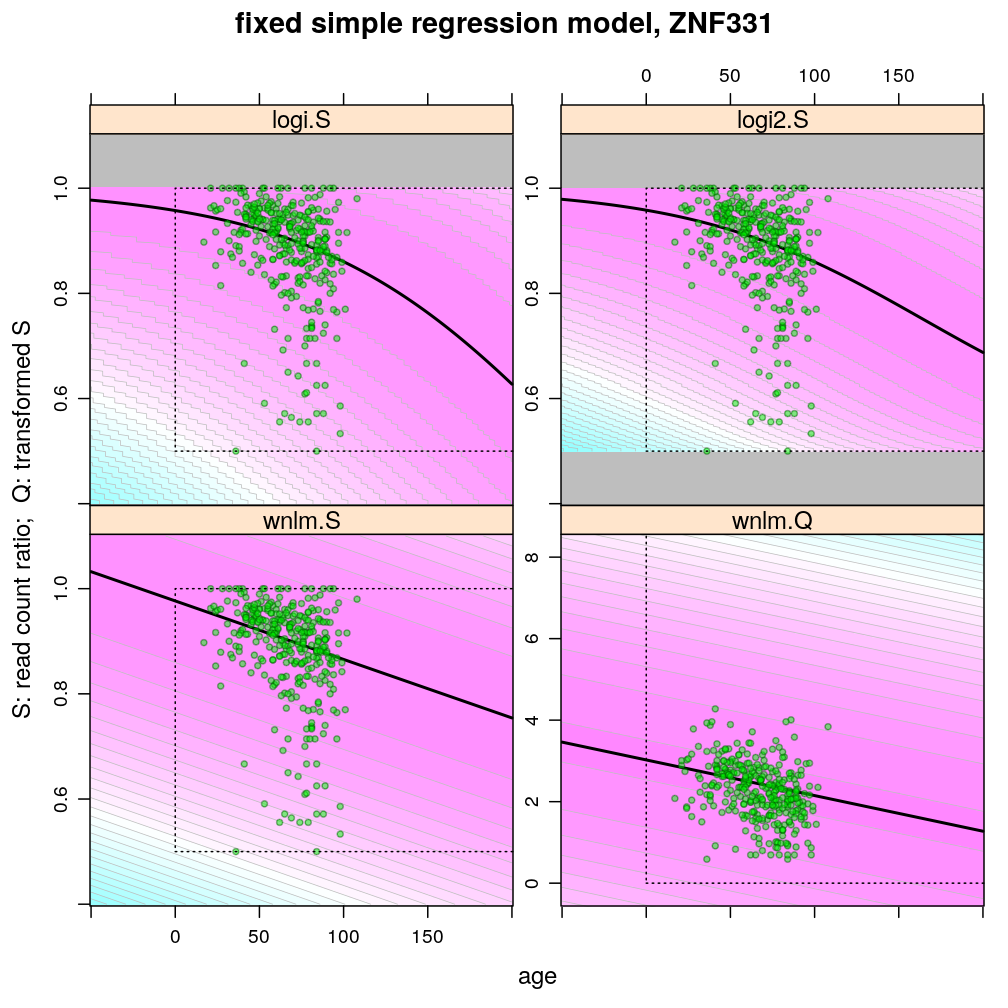
For certain genes allelic bias was found to depend on biological predictors (Age, Dx, Ancestry) in our previous analysis. That analysis fitted various fixed effects multiple regression models (GLM family) using as response variable the read count ratio or its quasi-log transformed version . After checking model fit, we primarily based our results to a weighted, normal linear model using , which we called wnlm.Q (as opposed to its unweighted variation unlm.Q). Significant dependence of the allelic bias of gene on (some level of) the predictor was assessed in terms of the estimated regression coefficient .
Beta From Mixed Model
Feb 14, 2017
For certain genes allelic bias was found to depend on biological predictors (Age, Dx, Ancestry) in our previous analysis. That analysis fitted various fixed effects multiple regression models (GLM family) using as response variable the read count ratio or its quasi-log transformed version . After checking model fit, we primarily based our results to a weighted, normal linear model using , which we called wnlm.Q (as opposed to its unweighted variation unlm.Q). Significant dependence of the allelic bias of gene on (some level of) the predictor was assessed in terms of the estimated regression coefficient .
Testing variancePartition
Feb 09, 2017

This short article presents the testing of Gabriel Hoffman’s variancePartition package on our read count ratio data. In particular, a mixed effects model is fitted with Institution, Gender, Dx, and RNA_batch having random effects on the read count ratio and all other predictors having fixed effects. No interactions are considered. The large residual variance is probably due to the large variation among individuals.
Gabriels Suggestions
Feb 09, 2017
Summary of our personal communication with Gabriel Hoffman.
Open Questions After Ms
Feb 08, 2017
Based on the criticism by some coauthors of our recent manuscript the decision has been made that the work needs a major revision. What should be that revision? Some key points are listed here.
Dataset For Regression
Feb 08, 2017
This short workflow exports the data onto which various GLMs have been fitted: the read count ratio for 30 genes (as response variables) and 12 predictors across 579 samples. The dataset (as a CSV file) was sent to Gabriel Hoffman for potential analysis.
Ravis Comments
Jan 27, 2017
From Ravi’s email to Andy (January 27, 2017 at 12:35:30 AM EST)
Changes To Manuscript
Jan 24, 2017
Following a discussion with Andy and Chaggai, and having received feedback from Doug, the following changes have been made to the manuscript:
Plotting Distribution Of S
Nov 01, 2016
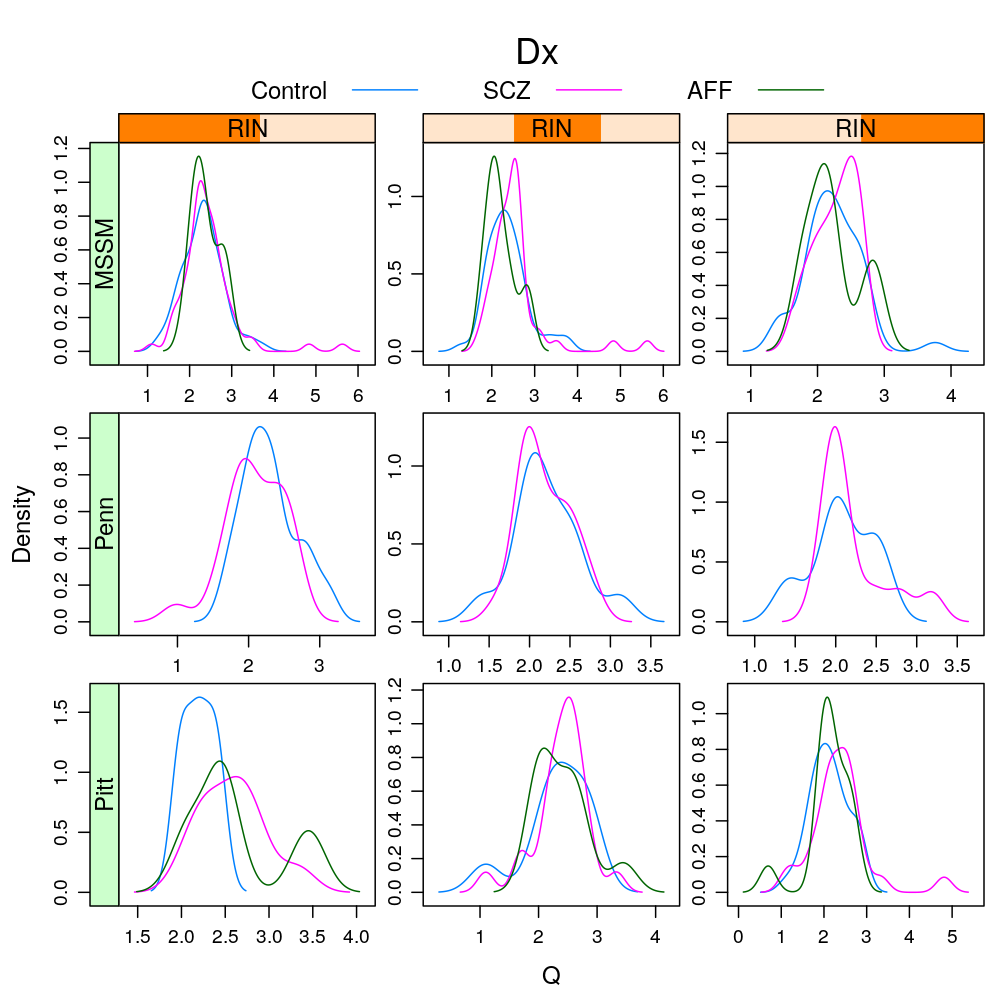
This analysis presents plots of the conditional distribution of the read count ratio statistic or its quasi-log transformed version given each a gene a predictor of interest, which is either Gender or Dx. For the predictor Age see the previous post trellis display of data. In the present post a more detailed conditioning is done, using RIN and Institution for MEG3 and MEST. These are genes found in a previous analysis (see permutation test) to be significantly associated to Gender and Dx, respectively. The plots below show that the distributions greatly overlap between differing levels of gender or disease even for the most significantly associated genes, and that this holds in case of further conditioning on RIN and Institution.
Differentially Expressed Genes in Schizophrenia
Oct 20, 2016

This analysis compares some gene sets raised by our study to the set of differential expressed genes in schizophrenia (SCZ) presented by (Fromer et al 2016) in their article Gene expression elucidates functional impact of polygenic risk for schizophrenia. For discussion see the post about affected genes.
About Affected Genes
Oct 19, 2016
Based on the aggregation of various p-values from a previous analysis, a list of those genes was collated, which are significantly affected by any of the four chosen coefficients (Age, GenderMale, DxSCZ, Ancestry.1) representing various biological variables (see signif-gene-effects-either.csv). These genes were then queried against Ensemble Genes 86 database, Homo sapiens genes (GRCh38.p7) using BioMart with the following HGNC symbols as input external reference IDs:
Theory Of Imprinting
Oct 17, 2016
This is a schematic review of literature on kinship theory and brain function that is relevant to our project.
Comparison To Mouse Cerebellum
Oct 11, 2016
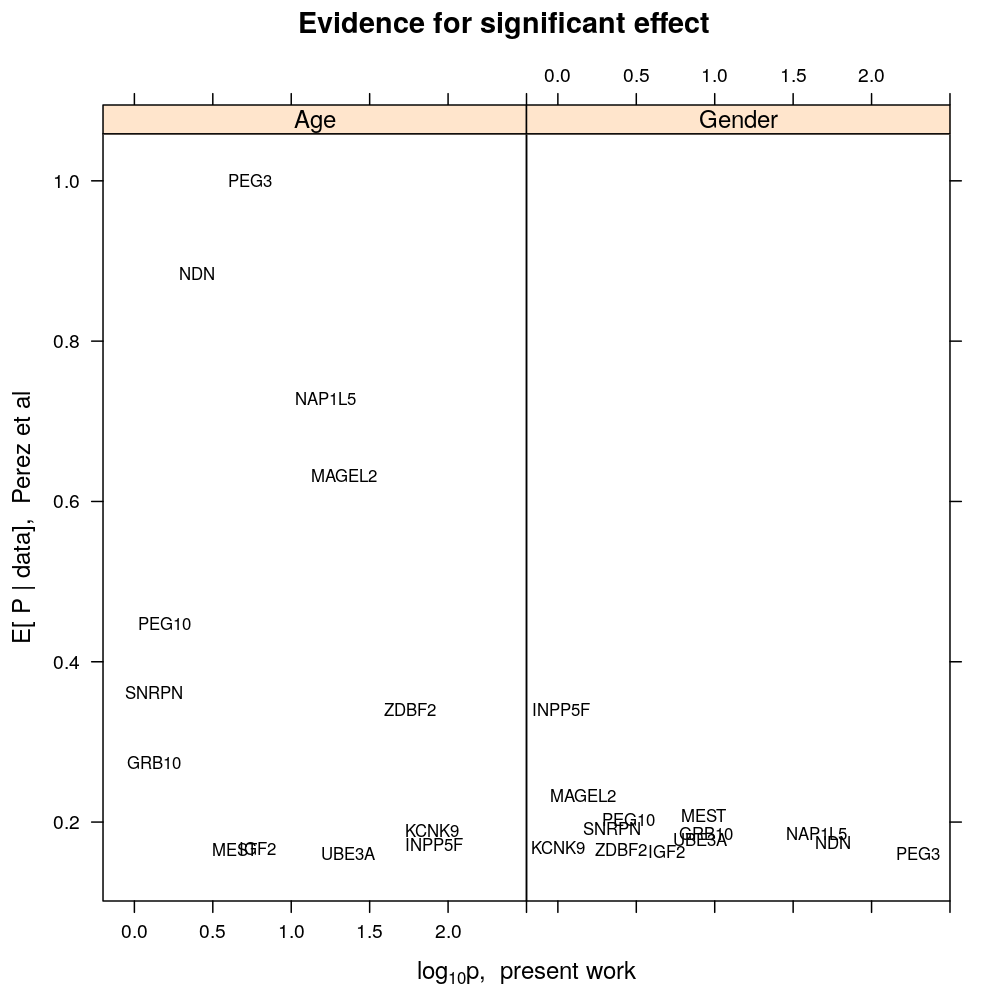
This analysis compares our findings on the biological regulation of parental expression bias to those published by Perez et al (eLife 2015;4:e07860), who presented and applied the BRAIM model to RNA-seq data from the cerebellum of P8 and P60 hybrid mice.
Permutation Test
Oct 03, 2016
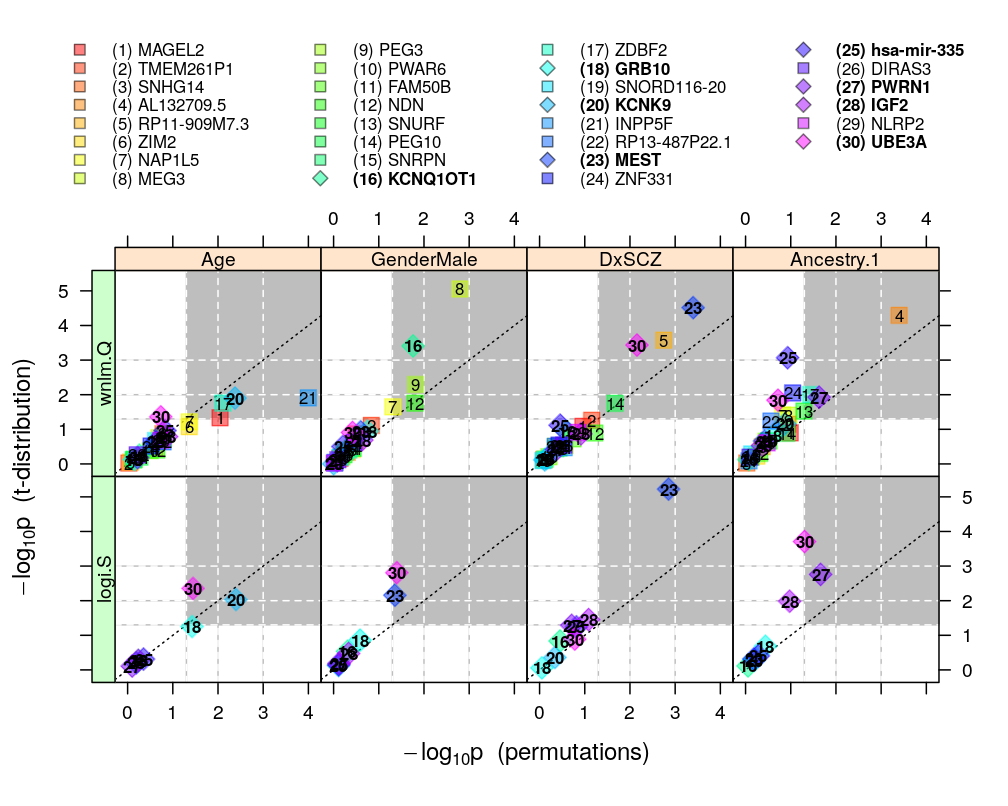
This analysis extends permuted observations to testing hypotheses for any gene. This is done by random permutation tests, which provide only approximate p-values in contrast with exact permutation tests (which are unpractical in the present case due to the large number of all permutations of cases). These approximations more or less agree with the “theoretical” p-values, which are based on the hypothesis that the Studentized follows a t-distribution on degrees of freedom (see ch8.3, p371 in A.C Davison: Statistical Models):
Model Checking
Sep 23, 2016
For a fixed set of terms in the linear predictor and for each gene, different data transformations, link functions, and error distributions are compared in terms of model fit. Fit is evaluated by diagnostic plots by inspecting the normality of residuals and the homogeneity of error (homoscedasticity). Although model fit varies across genes, taken all genes together the wnlm.Q and unlm.Q models emerge as the best fitting ones.
Permuted Observations
Sep 20, 2016
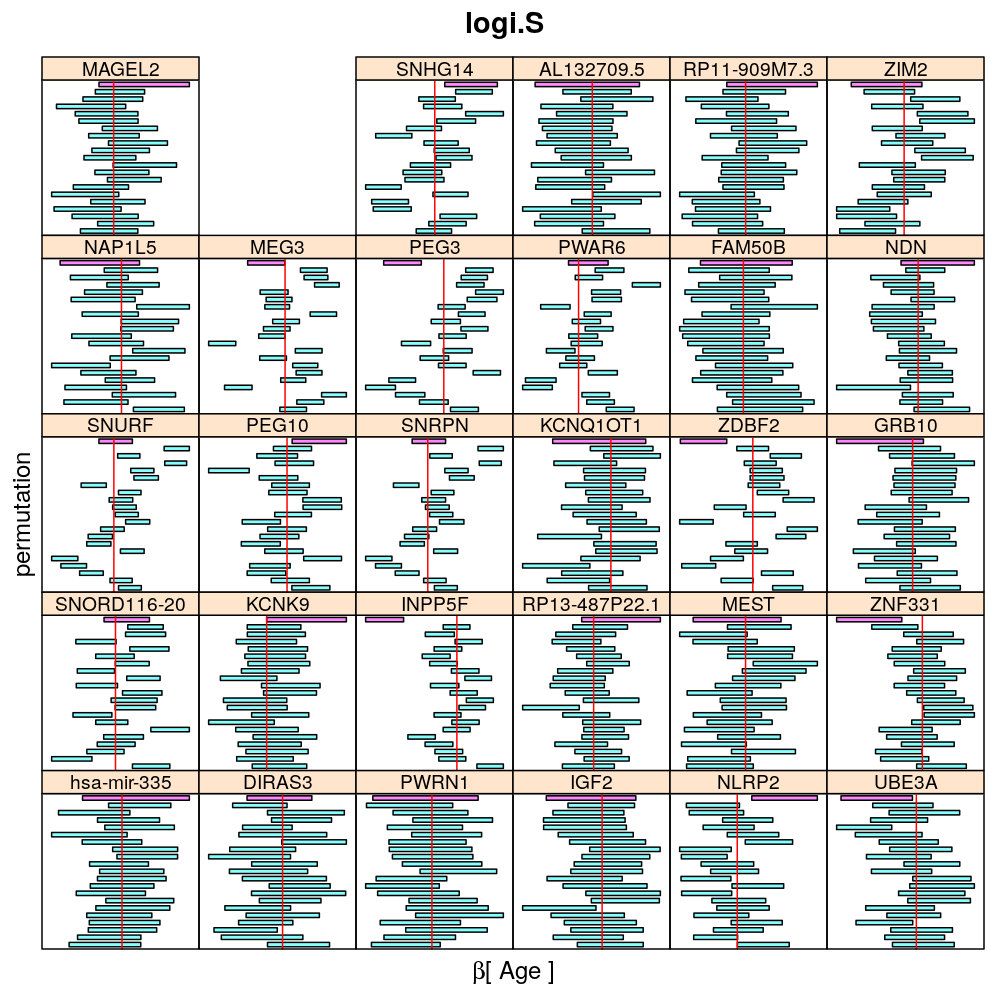
The present analysis investigates more thoroughly the significance of effect on read count ratio of various predictors for various genes. This is done by random permutations of the observed values of any given predictor and fitting the same models to both observed (unpermuted) and permuted data. This approach is thought to provide more accurate p-values and confidence intervals (CIs) than deriving those from only the observed data using the standard way based on normal distribution theory (see ch8.3, p371 in A.C Davison: Statistical Models), which is very sensitive to the quality of model fit. Indeed, a general finding from this analysis is that some genes show more unexpected distribution of CI than others and that variability is explained by diagnostics of model fit for the corresponding genes. See model checking for details.
Design Matrix
Sep 20, 2016
Some shortcomings of the previous design matrix are inspected and corrected here. These include highly collinear terms as well as awkward allocation of control and treatment factors.
Glm Sampling Distributions
Aug 23, 2016
This article illustrates some of the properties of the various regression models (logi.S, logi2.S, wnlm.S, wnlm.R, unlm.S, unlm.R) used to fit the Common Mind data as well as the properties of the data themselves
Likelihood Surface
Aug 21, 2016
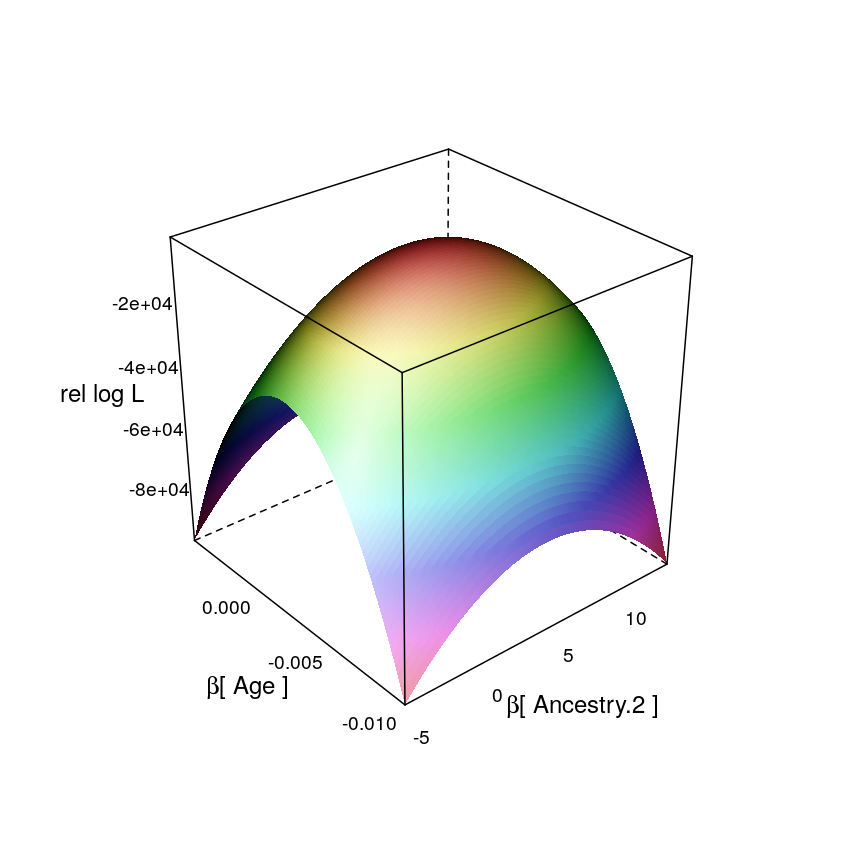
In the present observational study the effects of predictors are random. Associations among predictors has a negative impact on maximum likelihood estimation (MLE) of the vector of regression coefficients . This is because the association (in the probabilistic sense, i.e. dependence) among predictors induces an association among the coefficients themselves in the sense of a specific directionality in the gradients of the likelihood surface; that directionality is what makes MLE less reliable. Confidence regions of all coefficients are quasi-ellipsoids on the -dimensional parameter space on which the likelihood function is defined.
Imprinted Gene Clusters
Aug 08, 2016
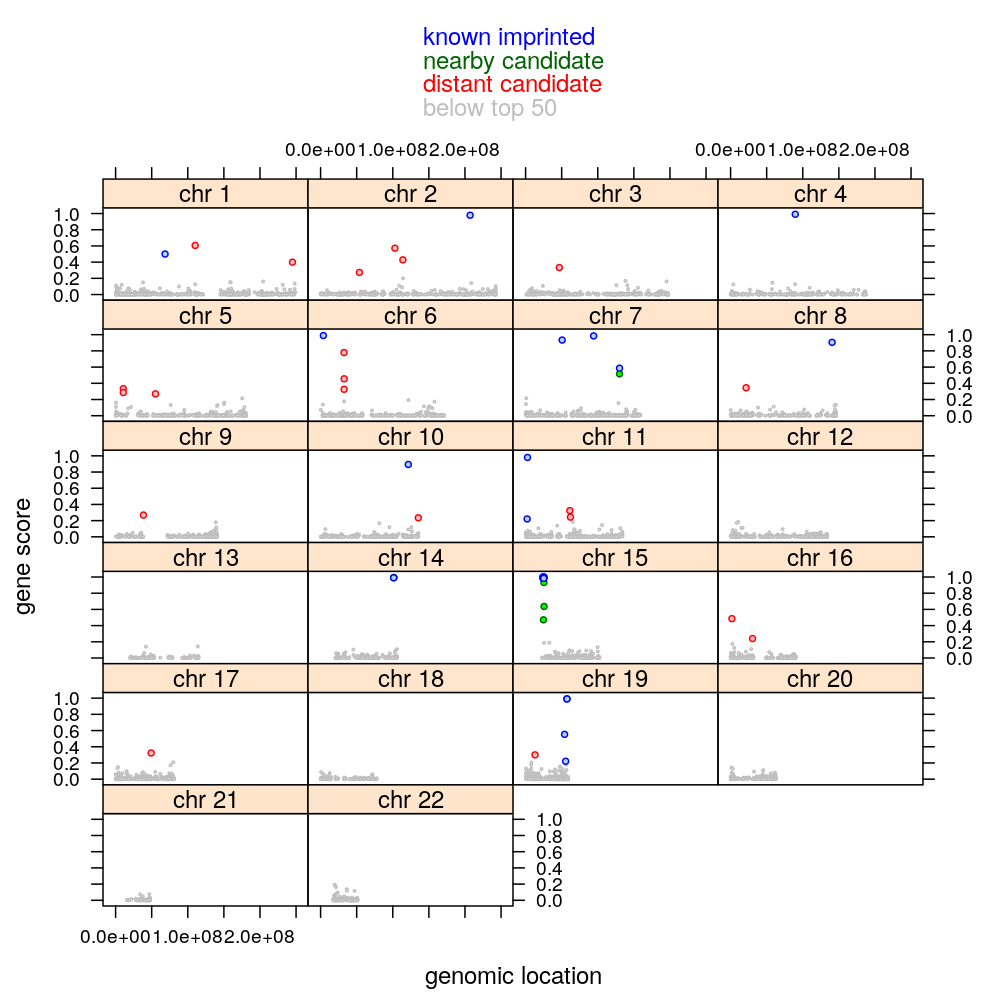
Imprinted genes form clusters of one or more genes. Previous work by Ifat established the imprinting status of each gene as either known to be imprinted, not known to be imprinted but near an “known” gene, or else neither. I refer to these three categories as “known”, “nearby candidate” and “candidate”, respectively.
Ifat's Filtering, Gene Ranking and Classification
Aug 01, 2016
It is crucial for publication to ensure that the genes selected for regression analysis were chosen on objective criteria. This requires the reproduction of the set of genes that were called monoallelic in the manuscript drafted by Ifat. I’ll refer to that in this document as the previous manuscript. If perfect reproduction fails then minimum discordance is desired, and the regression analysis will potentially need to be repeated accordingly with the new set of genes called monoallelic.
Interpretation of the Black Bars
Jul 25, 2016
What is the precise meaning of the sentence below, taken from Ifat’s manuscript?
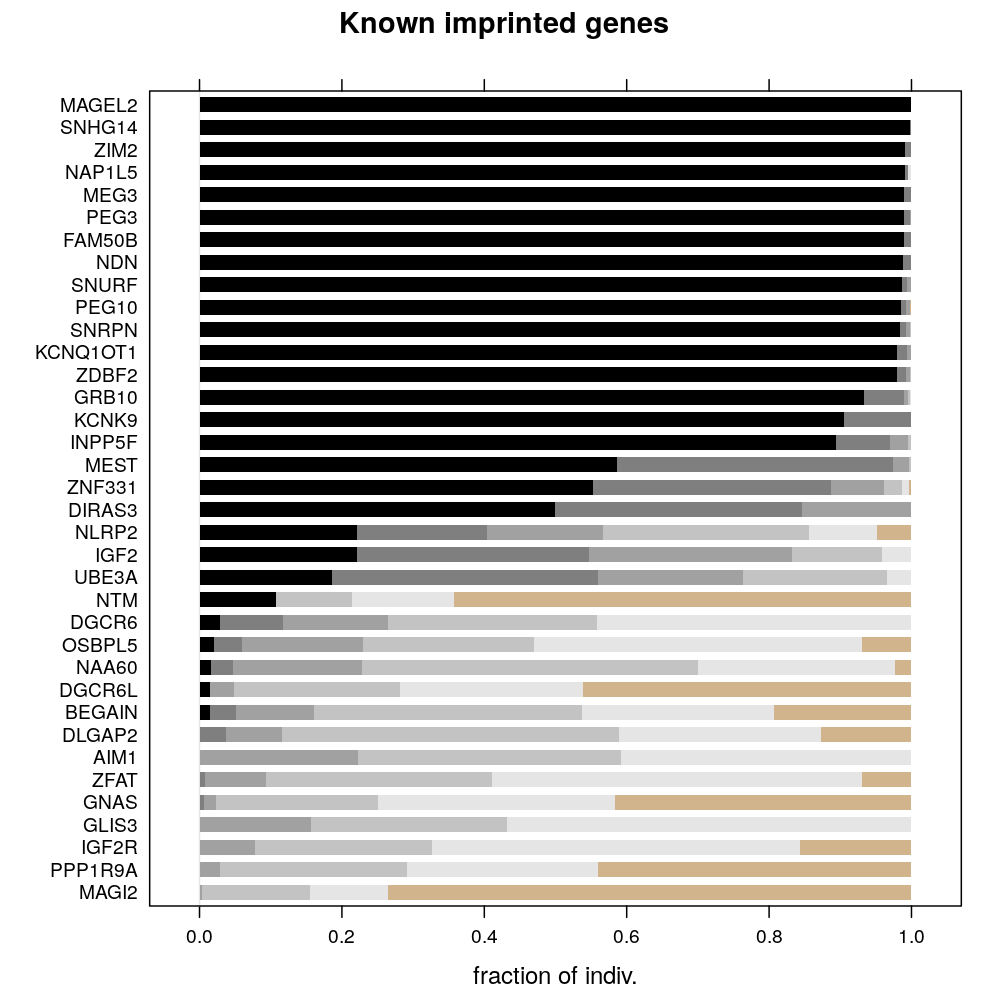
Genome-wide Extent of Monoallelic Expression
Jul 19, 2016
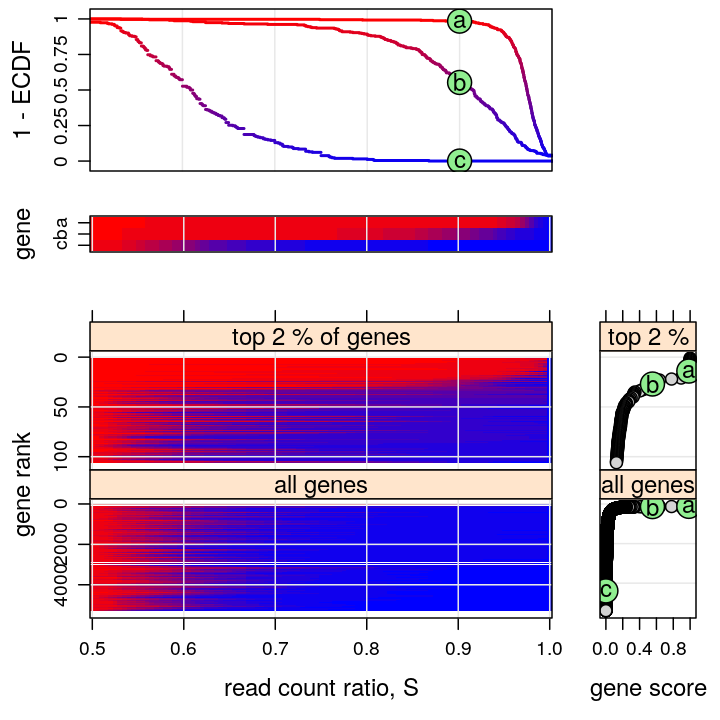
Various plots present the distribution of read count ratio across individuals and genes jointly. Genes are also ranked using a summary statistic derived from the empirical distribution of read count ration across individuals for each given gene.
Imprinting Resources
Jul 14, 2016
Some online resources (knowledge bases, catalogs) relevant to this study are listed here.
Conditional Inference
Jul 08, 2016
The present article extends previous inference of regression parameters (see extending ANOVA) with a conditional analysis. Operationally, conditioning takes a subset of all observations (i.e. individuals/RNA preparations) defined by a condition. In the present, rather special, case a condition is defined by a single level of a single factor-type (i.e. categorical) predictor/explanatory variable. However, more general conditioning setups could also be explored. In that case multiple predictors might be selected, of which some might be continuous (i.e. a covariate) while others categorical, and for each predictor a possibly compound event (e.g. multiple levels of a factor) might be taken.
Trellis Display of Data
Jun 26, 2016
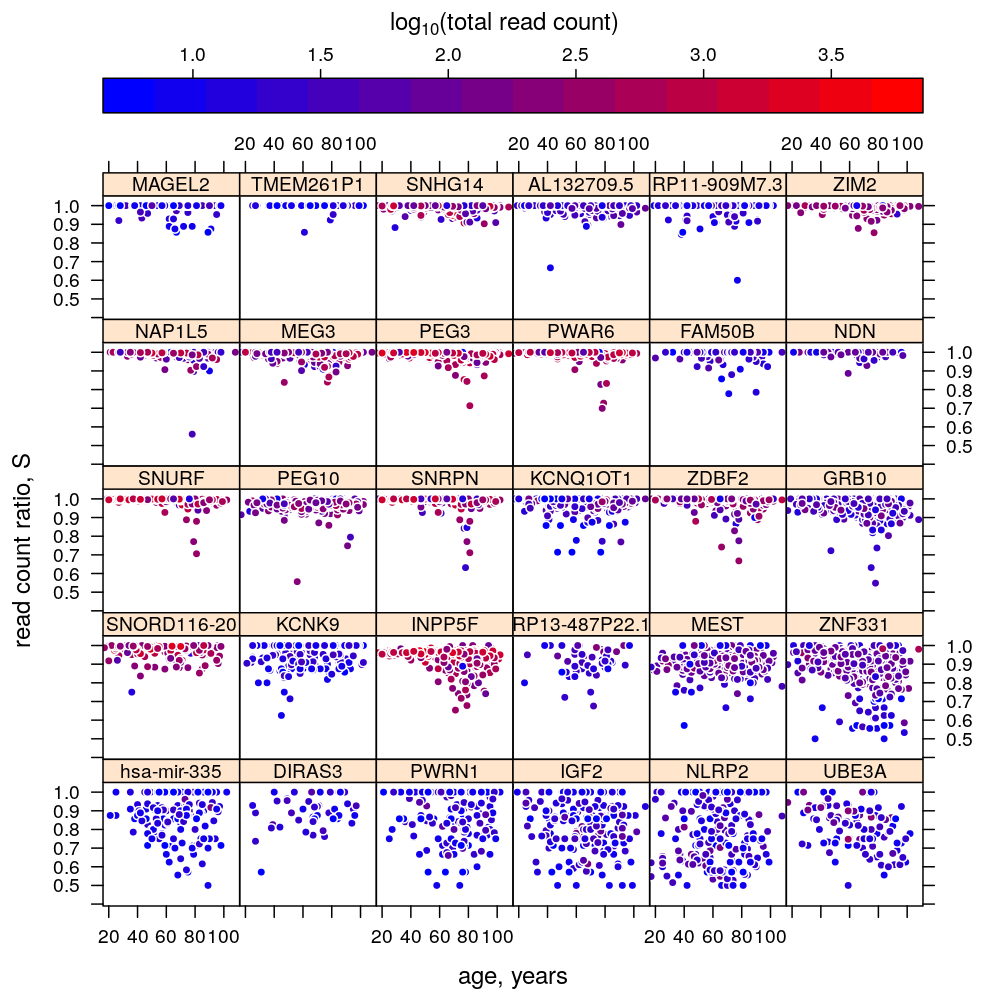
Improved graphical overview of data and results pertaining to the recently extended regression analysis and ANOVA
Extending ANOVA
Jun 22, 2016
The analysis presented here follows up on the previous ANOVA and extends it in two ways:
Extending Regression Analysis
Jun 17, 2016

The analysis presented here follows up on earlier fitting of regression models on statistics (like ) based on read counts; somewhat less relevant the subsequent comparison of regression models. Data processing steps as well as several notations and computational objects were introduced in the article on data import.
Checking New Implementation
Jun 15, 2016
Some of the key functions have been reimplemented for more robustness and modularity. These checkups show that the new implementation is correct.
Import Data
Jun 07, 2016
Here all read count data are fetched from Ifat’s website using hacks that aim to extract information from HTML tables.
Adopting limma and voom
Jun 03, 2016
The R packages limma and voom have been developed for analysis of RNA-seq read count data, whereby RNA-seq artifacts are modeled successfully, as it was demonstrated. Here I consider employing limma and voom for our study.
Comparing Regression Models
May 07, 2016
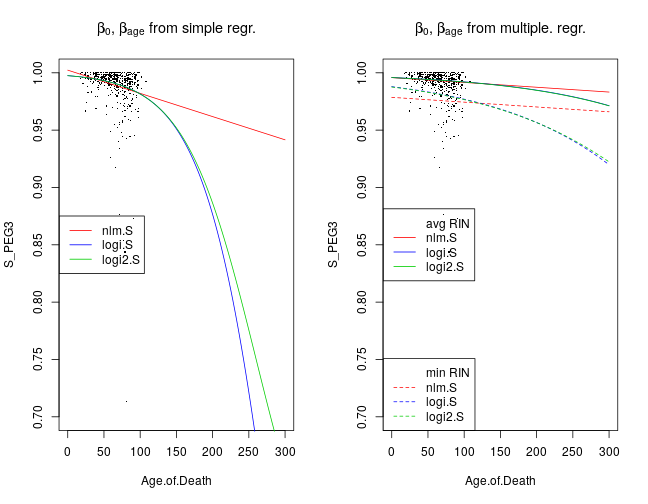
This post follows up on a previous regression analysis, which used fitted several regression model types (nlm, logi, log2) to the data concerning monoallelic expression, and the effect of age and other explanatory variables. The goal here is to compare these models to select the one(s) with the most desirable properties.
Aims And Requirements
May 05, 2016
What are the aims of the project? The question is stated from a modeling viewpoint.
Logistic Models Using the S statistic as Response
Apr 22, 2016
Previous analysis by Ifat analyzed the relationship between age and allelic imbalance by fitting a normal linear model to rank-transformed values averaged over a set of genes. My follow-up analysis extended this to a set of genes. Here alternative models are fitted directly to the (untransformed) values. Furthermore, all models are fitted to not only aggregated gene sets but also single genes. Models are compared based on the Akaike information criterion (AIC).
Bayesian regression allelic imbalance model (BRAIM)
Apr 14, 2016
The Bayesian regression allelic imbalance model (BRAIM) was published by Dulac and coworkers (Perez et al, eLife 2015;4:e07860) and was applied to RNA-seq data from the cerebellum of crossed F1 hybrid mice in same study to investigate:
The Gregg-Dulac Definition of Imprinted Genes
Apr 11, 2016
Gregg et al in the Dulac lab found unexpectedly many (> 1300) imprinted genes genome-wide. However, DeVeale, der Kooy and Babak repeated that study and suggested that most of the positive calls by Gregg et al were false. These authors estimated only 175 imprinted genes genome-wide. (A side note: neither of these studies investigated the within-gene variation of imprinting across individuals.)
Age Distribution
Mar 28, 2016
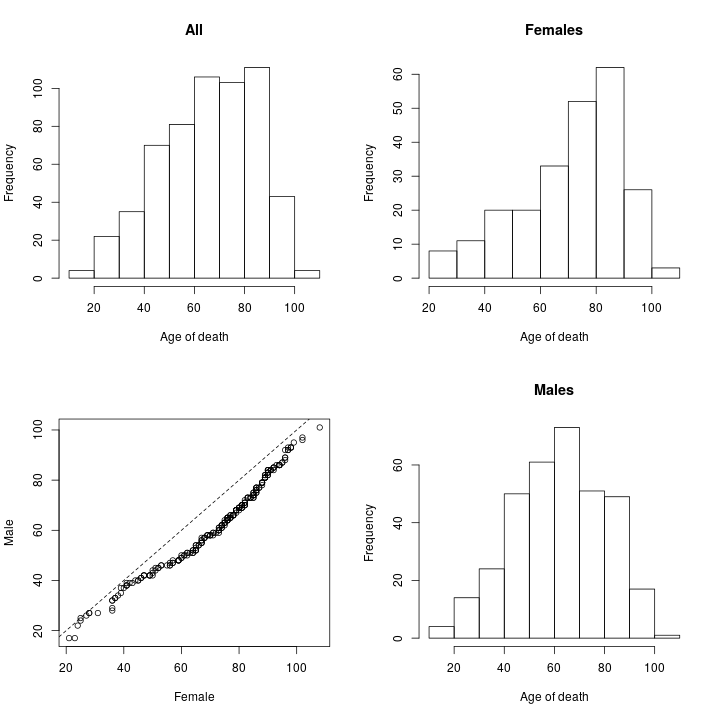
This is an explanatory, qualitative, analysis on the distribution of the age of death among the studied individuals from the CommonMind Consortium. The conclusion is that biological variables such as gender and psychiatric state do seem to affect age of death but such qualitative analysis is insufficient to confidently disentangle these biological variables from psychological, social, institutional, and other biomedical variables.
Regressing Read Counts
Mar 18, 2016

This document supplements the article Binomial Models.
Repeating Ifat's Regression Analysis with 5 More Genes
Mar 02, 2016
Goal: reproduce and extend Ifat’s previous regression analysis (documented here, see also speaker notes for that slide) using the following sets of genes:
Binomial Models
Feb 19, 2016
An article is accessible here, which proposes a statistical model-based inference on allelic bias.
Error Rates and Mixture Distributions
Feb 15, 2016
Some considerations on error rates for discovering imprinted genes.
Project on Monoallelic Expression: a Statistical View
Feb 10, 2016
I wrote a article (accessible here) with the same title as this post. The article evaluates the current state of the “monoallelic expression project” (MAE) by
Modeling Consideration
Feb 09, 2016
In this note I identify some shortcomings of our project “monoallelic expression in the brain” in its present state (see the project page, slides and manuscript), discuss their impact on the study, and make suggestions for amendments. In short, those shortcomings are the implicit treatment of…
More Discussion on the "Monoallelic Expression (MAE) Project"
Feb 04, 2016
This is a discussion on Ifat’s draft in order to complete the research project.
Notes on the "Monoallelic Expression (MAE) Draft"
Jan 22, 2016
Manuscript title: Novel monoallelically-expressed genes and relaxation of imprinting with advanced age in the dorsolateral prefrontal cortex.